Consultation
| Dokumendiregister | Sotsiaalministeerium |
| Viit | 1.4-2/2120-1 |
| Registreeritud | 18.08.2025 |
| Sünkroonitud | 19.08.2025 |
| Liik | Sissetulev kiri |
| Funktsioon | 1.4 EL otsustusprotsess ja rahvusvaheline koostöö |
| Sari | 1.4-2 Rahvusvahelise koostöö korraldamisega seotud kirjavahetus (Arhiiviväärtuslik) |
| Toimik | 1.4-2/2025 |
| Juurdepääsupiirang | Avalik |
| Adressaat | WHO |
| Saabumis/saatmisviis | WHO |
| Vastutaja | Agne Nettan-Sepp (Sotsiaalministeerium, Kantsleri vastutusvaldkond, Euroopa Liidu ja väliskoostöö osakond) |
| Originaal | Ava uues aknas |
| Taotle dokumendi eemaldamist või parandamist |
Failid
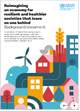
The Second WHO European Health Equity Status Report – 2025
Healthy prosperous lives for all
The purpose of this document is to provide information to Member States to support their review and any comments on the data indicators and graphs that will be included in the 2nd Health Equity Status Report that will be launched in November 2025.
Introduction
The WHO European Health Equity Status Report initiative (HESRi), launched in 2019, provides data-driven insights to support policy actions that address health inequities (1).
Since its launch the work has inspired local and national authorities to strengthen their health equity policies, has informed the work of international bodies (EU institutions and agencies, OECD), and has been a catalyst for new alliances across countries and communities of practice. The work has spearheaded political commitments and the creation of practical resources to drive action on health equity and well-being – enabling governments and health authorities to progress efforts towards creating a healthy life for all.
Continuing this work, WHO Europe is currently preparing a Second Pan European Health Equity Status Report. This will bring together the latest available status and trends in health equity and well-being within and across countries of the WHO European Region.
The second HESRi Report will delve into Health equity across the life course with a spotlight on children and young people and on healthy ageing. This is in the light of major demographic shifts in the age structure of populations within countries in the European Region. The 2nd HESRi report will use innovative techniques to capture health equity status and trends of men and women at different stages across the life course. It will show how these are associated with key features of i) health systems; ii) social relations and participation, education and learning iii) living conditions; iv) employment and work and v) income security, and set out options and solutions for reducing inequities and accelerating progress for healthy and prosperous lives for all, with co-benefits for societies with higher trust and life satisfaction, more resilient public systems and fiscal stability.
Figure 0.1 Essential conditions for a healthy life
The 2nd Health Equity Status Report will be launched in Europe in November 2025
Background
• The 2nd Health Equity Status Report (HESRi2) is a comprehensive review of the status and trends in health inequities and of the essential conditions needed for all to be able to live a healthy life in the WHO European Region.
• Improving health and well-being for all, reducing health inequities and ensuring no one is left behind will bring wider economic, social and environmental benefits to Member States.
• This report seeks to change the common perceptions that health inequity is too complex to address and that it is unclear what actions to take and which policies and approaches will be effective.
• The HESRi2 captures the progress made in implementing a range of policies with a strong effect on reducing inequities and demonstrates the link between levels of investment, coverage and uptake of these policies, as well as the gaps in the essential conditions needed to live a healthy, prosperous life.
• The report will support WHO and Member States to implement the health equity priorities set out in the draft 2nd European Program of Work (EPW2) (2)
Indicators that measure poverty risk, income security and the adequacy and coverage of social protection and welfare policies that
protect health over the life-course
Indicators that measure the health impact of employment and working conditions, including availability, accessibility,
security, wages, physical and mental demands, and exposure to unsafe work
Indicators that measure differential opportunities, access and exposure to living conditions and environmental factors that
impact health and well-being
Indicators of human capital that measure the access availability and affordability of education, learning and literacy;
Indicators of social capital that measure social inclusion exclusion, levels of trust, safety and participation of individuals and communities
in society.
Indicators that measure the availability, accessibility, affordability and quality of prevention, treatment and health-care services
andprogrammes
Health Health Services
Health Social and Human Capital
Health iving Conditions
Health Employment and Working Conditions
Health Income Security and Social
Protection
HESRi2 data
• The HESRi2 analysis and findings are generated from a new dataset. It brings together three types of data (Fig. 0.1) and uses innovations in analytical methodologies to provide a better understanding of health equity, the pathways that generate equity and inequities, and how policy interventions are associated with the rate of progress to reduce gaps in health and well-being, across the countries of the WHO European Region (Annex 1).
• The HESRi2 data and analysis provide the following benefits.
1. Country-specific data allow governments to strengthen decision–making, tailoring their action and investment for health equity accordingly.
2. Analysis supports ministries of health to demonstrate how events and decisions made in other sectors contribute to and interact with inequities in health and well-being.
3. Evidence that enables national and subnational governments and health authorities to improve policy coherence, leading to improved equity in health and in life chances.
F g 0. P g g m H SR
HESRi2 uses a range of data analysis and visualizations to support a robust understanding of the current status of health inequities within countries. It also captures whether there
have been significant reductions or increases in these inequities over a period of 10–15 years (trend analysis data) (Annex 1).
• Gradient charts are used to show the socioeconomic gradient for an indicator, such as self-reported health, by examining how levels of the indicator vary between subgroups of people. Either three or five subgroups are defined according to markers of socioeconomic status - for example, level of education (three groups) (Fig. 0.2), or income or wealth (five groups). For people belonging to each subgroup, the average level of the indicator is calculated and represented in the chart by a different coloured dot.
• Gap and trend charts are used to show the difference, or gap, in average levels of the indicator in the most advantaged subgroup compared to the most disadvantaged subgroup. For example, the charts show the difference between those in the highest and lowest income quintiles or between those with highest level of education (degree-level) and those with least (lower-secondary or below). The traffic light symbols in these figures also show whether the size of the gap for each country has narrowed, widened, or stayed the same over a specified time frame (e.g. Fig 0.3).
• Decomposition charts are used to show how shortcomings in each of the five essential conditions, when combined, contribute to the gap for a given health indicator, such as mental health or limiting illness. The decomposition charts enable policymakers to see more clearly the relative weight of each condition in contributing to (in)equity in a specific health indicator (Annex 2).
• Equity tracker charts show, for each country, a summary outcome for either individual indicators or groups of indicators. The outcomes include the level of inequality or the direction of the trend in inequality. The groups of indicators are the five essential conditions, while the individual indicators are either health outcomes or variables contributing to one of the essential conditions (Annex 2).
Health equity – recent status and trends
1) Health and wellbeing status
Enshrined in the WHO constitution (3) is the principle that “health is a state of complete physical, mental and social well-being and not merely the absence of disease or infirmity.” Underlying this are, among other principles “the enjoyment of the highest attainable standard of health is one of the fundamental rights of every human being without distinction of race, religion, political belief, economic or social condition” and “Governments have a responsibility for the health of their peoples which can be fulfilled only by the provision of adequate health and social measures. In this section of the report, the current status and trends in inequalities in health and wellbeing outcomes within each member state in the European Region are summarized. The graphs likely to be used to illustrate this are shown below. A full list of indicators from which the summary will be drawn is given in Annex 4. The social conditions which give rise to and can be a consequence of the inequities in health and wellbeing are summarized in the section that follows this one.
F g . L x b b b g x, M mb S
F g . P g b m q ,
M mb S
F g .3 P g m
b m b , M mb S
F g .4 C q g
g b m q x, M mb S
2) Essential conditions for health and wellbeing
The analysis presented in the first HESRi report identified the five essential conditions needed to live a healthy life in Europe in the 21st Century as listed in Figure 0.1. This section provides a brief rationale for each of these five conditions and graphs that will be used illustrate status and trends in the indicators related to these conditions. A full list of the HESRi indicators relating to each condition is in Annex 3. Commentary on each condition will draw on a selection of these indicators.
2.1 Health systems
Health systems have a key role in addressing equity in health. Inequities in health will result if the provision of prevention and treatment are unequally distributed in the population – the inverse care law (4). But the health care system can do more than this – it can contribute to the reduction of inequities resulting from social conditions that lead to ill health and a lack of wellbeing. To do both of these, the health system must be universal – providing care for everyone, offering high quality care to all, affordable – ensuring that any out of pocket payments do not place a disproportionate burden on anyone and are responsive to need – do not leave anyone with unmet healthcare needs.
Universal health coverage has an equity impact through ensuring that everyone can use appropriate and effective health services without experiencing financial hardship, irrespective of ability to pay, age, ethnicity, disability, geographical location, race, religion, sex, or sexual orientation. People experience financial hardship when out-of-pocket (OOP) payments are large in relation to their ability to pay for health services. ack of financial protection can lead to or deepen poverty, undermine health, and exacerbate health and socioeconomic inequities. Where health systems fail to provide adequate financial protection, people may be forced to choose between using health services and meeting other basic needs such as food, housing and heating. This has a negative impact on health and well-being, which in turn further increases the risk of socioeconomic vulnerability and exclusion (5). Policies that distribute more resources to areas with greater health, social and economic needs have a positive impact on reducing health gaps between social groups and geographical areas (6).
The quality of health care has an equity impact because health outcomes improve with better quality care (7). Therefore, equitable provision of good quality care reduces gaps in outcomes. Differences in the quality of care arise from differences in the geographical distribution of health services in low- and high-income neighbourhoods or other forms of discrimination that result in lower-income households receiving lower-quality care and poorer health outcomes.
Unequal quality of health care is frequently found between providers catering to low- or high-income neighbourhoods and between private and public providers, mirroring inequities in socioeconomic status and health outcomes. Disaggregation by education level, income and sex allows this indicator to monitor equity in the quality of health care received based on socioeconomic status.
F g . C q g
g m b m q x, M mb
S
F g . C q g - - k x
x , M mb S
F g .3 C q g
w g , M mb S
O - - k m g 40
2.2 Social and human capital
Early childhood development lays the foundation for physical and mental health and well- being outcomes throughout the life course (8). Investment that reduces health risks and vulnerability in the prenatal period and early childhood help parents with lower resources give their children a healthy start in life. Equal access to good quality education from an early age has a strong impact on reducing differences in opportunities and risks, which has both direct and indirect impacts on health. Continued access to education and lifelong learning opportunities has a direct effect on promoting social and economic inclusion and mental well-being). It also has indirect effects linked to increased health and social literacy, such as awareness of health risks and behaviours and mediating life chances and the effects of social and economic shocks (8,9).
Mattering - experiences of feeling valued and adding value (10) -is related to positive outcomes when present, and negative results when absent. When people are treated with dignity and respect, the overall sense of mattering and wellbeing increases. When people perceive that they do not matter, their overall wellbeing suffers greatly. This is the case because people have a fundamental need to experience social worth. Meaningful participation in society, trust in others and being able to influence decisions affecting health and life chances have important direct and indirect health effects. They contribute to stronger individual and social resilience and lower levels of morbidity and poor mental health. Exposure to low-trust environments characterized by higher crime rates, social isolation and lack of ability to influence politics and decision-making in society are strongly associated with poor mental health and a higher risk of morbidity (11).
Participatory public services empower people to take control over their lives and the determinants of their own health. Investment in civic participation, reducing crime and generating social connections have positive impacts on the health and well-being of individuals through their engagement with, and trust in, the local community and wider society (6,12).
F g .4 C q g g 6
w m w m / m , M mb
S
F g .5 P g 8 g w
m w b x,
M mb S
2.3 Living conditions
Shelter is a fundamental human need, providing safety, a sense of belonging, peace and security. Poor housing and poor health are inextricably linked. People living in unaffordable, poor-quality or insecure housing are more likely to report poor health and to suffer from a variety of health problems (13,14).
Differences in the quality of the local environment in which people live have an impact on health equity. ow-income households and neighbourhoods are less likely than those who are wealthier to be in, or have access to, safe, health-promoting environments (14). ocal environments that are detrimental to physical health may also generate stress and anxiety, providing an additional link between physical environment and mental health (14,15). Policies that shape geographical planning, construction and management of public spaces can reduce health inequities due to the local environment (6).
Commercial organizations influence all aspects of life and can therefore have either a beneficial or harmful influence on health equity. Marketing and product exposure, to influence the consumption of alcohol, tobacco and food items, affect the risks of noncommunicable diseases and mortality. This has an impact on health equity because commercial influence varies with how well people are educated about the health risks of detrimental consumption behaviours, whether their economic situation and social environment encourage or discourage them from such consumption behaviours and whether they have easy access to healthy alternatives.
F g .6 P g w g
m j b b m q x, M mb S
More han 4 % of di po able ho ehold income (ne of ho in allowance )
2.4 Employment and working conditions
Productive participation in the labor market can have a positive impact on health equity at an individual level - through its effects on material conditions and on life chances – and at a societal level – through creating the macro-economic resources that underpin policies to enable people to prosper. People who have experienced long-term unemployment are at a higher risk of premature mortality. Young people who have experienced long-term unemployment are more likely than those who have not experienced unemployment to report risky health behaviours, at all levels of socioeconomic status.
Good work is an essential requirement for health. Job insecurity, temporary employment and poor or stressful working conditions are associated with poor mental health, self- reported ill health and an increased risk of fatal and non-fatal cardiovascular events. Excessive hours and few contractual rights directly and indirectly contribute to inequities in physical and mental health. Work-related stress follows a social gradient (16).
Systematic differences in exposure to poor working conditions are closely associated with gender norms and the workers’ age and education level. Discrimination in the labour market exists between sexes. socioeconomic and migrant groups, and persons with disabilities. Ensuring equitable participation in secure and decent employment has the potential to address health and social inequities, including gender inequities, by providing equal opportunities to obtain a secure income (16).
F g .7 P m b b
x, M mb S
F g .8 C w k w w k 40
m w k b x, M mb S
2.5 Income security and social protection
The risk of poverty directly correlates with early-onset morbidity and premature mortality. Repeated or long-term exposure to financial insecurity predicts the likelihood of poor self- reported health, depression and the inability to meet the basic needs to live a healthy life, such as food, fuel and shelter (15). Non-stigmatizing social protection policies have positive effects on reducing health inequities related to income insecurity and poverty.
Investment in social protection for families and early childhood reduces health inequities by weakening the link between socioeconomic disadvantage and poor child health outcomes, including infant mortality and adverse child development (8,17). Such investment contributes to meeting children’s basic needs and helps them reach their full potential in life and health, irrespective of their or their parents’ sex, disability, race, ethnicity, origin, religion, and economic or other status (18).
Social protection programmes that support older people have an impact on health equity by maintaining their capacity to avoid health risks, access health services and perform daily tasks, especially for those with financial and health vulnerabilities. Older people, especially those from low-income backgrounds, are likely to have greater health-care needs or caring responsibilities for partners, and financial support through pension systems helps reduce their risk of ill health, disability and social exclusion (19). Women live longer than men, spending more of their lives in ill-health and are more likely to have caring responsibilities. Social protection and pension provision among women are key to addressing the resulting gender gaps in health, wellbeing and social conditions of older women.
F g .8 C k
, M mb S
Income below 6 % of median eq ivali ed di po able income (EUSILC) or national pover y line (World
Bank)
3) Deep dive into equity across the life course
3.1 Demographic change
The age structure of the region is changing, but not in exactly the same way in every Member State. Two simple summaries of the age structure of a country are the ratio of children (ages 0 to15) to working age adults (ages 15 to 64) and the ratio of old people (ages 65 and over) to working age adults. These ratios affect both the number and types of health events that occur in a country – often forming the focus of the health system – and also the capacity of the working age population to fund public services – principally health, social protection, education and pensions – required by children and the elderly, particularly the most vulnerable.
In every member State in the region, the ratio of older people (aged 65 and over) to those of working age (ages 15 to 64) increased in the ten years to 2024. At the same time, the ratio for those below working age (aged under 15) increased in around half of Member States and decreased in the other half of States. While a decrease in the ratio of young people reduces the short-term burden, in the longer term it suggests a reduction in the size of the working population. Although the two scenarios ultimately require similar policy responses, these will differ in terms of timescales and implementation plans.
These changes form the backdrop to the life course approach taken in this section, emphasizing what is happening to inequalities in children and young people, how ageing healthily varies across social groups and how gender differences persist across the region.
Health advantage and disadvantage accumulates across the life course – from the point of conception (and before), the conditions in which a child’s parents find themselves influences the child’s development, health and life chances. These influences are amplified by the education, training and employment opportunities experienced at the end of schooling. These, in turn, affect the income that a person can obtain, the control they have over subsequent life chances and the extent to which they matter in society. These can then influence the pension they receive in retirement. At each stage in this journey, the risk of developing a health problem increases and this can affect life chances and is affected by the conditions experienced. It is this combination of the essential conditions and health that therefore affect whether or not an individual is likely to age healthily.
F g 3. Y g
g
, , M mb
S
Yo n a e dependency
ratio i he ratio of
pop lation a ed nder
year o ha a ed
o 64 year of a e (a a
percen )
Old a e dependency
ratio i he ratio of
pop lation a ed 6 year
and over o ha a ed
o 64 year of a e (a a
percen )
3.2 Children and young people
As indicated above, child development is important to both health in childhood and adolescence and to thriving as an adult – the ability to obtain and maintain the skills needed in adulthood, good work, decent housing and live healthily in a healthy environment.
Psychological factors are important in achieving this trajectory to good health. This includes a sense of wellbeing and mattering, life satisfaction, freedom from bullying and depression and a positive digital life. These are all interconnected. Failing physical or mental health at an early age can easily derail this trajectory to good health.
F g 3. P g - 5 g b m
ffl x, 00 - 0
So rce: HBSC, 4 co n rie
F g 3.3 P g 5 g
b m ffl x, M mb S
F g 3.4 P g - 5 g b g b w
m m , b ’ m m x (HDI)
x, 00 - 0
So rce: HBSC, 44 co n rie
F g 3.5 P g g 5 g m m m
m m g, b ’ m m x (HDI)
x, 00 - 0
So rce: PIS , 44 co n rie
F g 3.6 C g g 5 4
w m m , g b x, M mb S
3.3 Healthy ageing
As described above, healthy ageing is a process that evolves through life and, consequently, the key equity aspects of this process are summarized in the preceding sections. In this section, the focus is therefore on how people prepare for old age – in terms of pension and long-term care provision- and the consequences this has for equity in old age – differences in pension coverage and health status.
F g 3.7 C - - k m g-
m g GDP, M mb S
F g 3.8 C x b
- g g w (PPS), M mb S
F g 3.9 P g 65 g m
b m b , M mb S
3.4 Gender
Gender differences permeate all aspects of life. Wherever the data permits, the preceding sections provide disaggregation by sex and highlight the existence of differences in the essential conditions and outcomes. In this section, the emphasis is on drawing tother the story painted by the data and identifying factors that are specially about gender roles – such as parenting – and gender-related violence. The absence of routine data on many gender-related issues is of concern.
F g 3. 0 W k m , b
, M mb S
( ) M
(b) F
F g 3. I m b m m m mb , m
00,000
So rce: E ro a , co n rie
4) Modelling
In the report, a variety of modelling tools are used to indicate (a) quantify the role of the five essential conditions (or their component indicators) in creating the equity gap in specific outcomes (such as limiting illness) in different contexts (such as life course stage, gender, sub-region) (b) the association between a change in one or more component indicators (such as poverty) and the size of the equity gap, indicating the potential, quantifiable reduction in the equity gap that could be achieved by taking action on specific social conditions (c) conversely, quantifying the extent to which improved health outcomes are associated with improved social conditions (e.g. improved mental health is associated with reduced unemployment). The technical details of the methodologies used in each type of modelling are summarized in Annex 2in the health equity gap.
F g 4. D m q g m g b g g R g
F g 4. R q g w m m q
m
F g 4.3 M ff m , b x m q
Income quintile Income quintile
4.4 R g , m m g
m m w m b m ,
0 0- 0 3
he effec of a one percen improvemen in ei her limitin illne or depre ion in red cin he nemploymen and NEE S ra e
5) Summary – equity trackers
The equity trackers provide an array of traffic lights that summarise, for each Member State, either (a) the level of inequality in each essential condition (or in the component indicators of an essential condition) or (b) whether the trend in inequality has shown a significant widening over time. These dashboards enable Member States to see, at a glance, where they are making progress and, conversely, where they need to focus greater effort.
F g 5. L
q
, b
M mb S
5.
q
,
b M mb
S
F g 4.3 L
q
m,
b M mb
S
References
1. Health Equity Status Report initiative (HESRi) products: 2019 https: www.who.int europe initiatives health-equity-status-report-initiative hesri-products
2. Developing the Second European Programme of Work 2026-2030 (EPW2):2025 https: www.who.int europe activities developing-the-second-european-programme-of- work
3. WHO constitution (with amendments): 2025 https: www.who.int about governance constitution
4. Tudor Hart, J The inverse care law. The ancet, 1971, Volume 297, Issue 7696, 405 - 412 https: doi.org 10.1016 S0140-6736(71)92410-X
5. Cylus J, Thomson S, Evetovits T. Catastrophic health spending in Europe: equity and policy implications of different calculation methods. Bull World Health Organ. 2018;96(9):599–609. doi:http: dx.doi.org 10.2471 B T.18.209031.
6. Poverty, social exclusion and health systems in the WHO European Region. Copenhagen: WHO Regional Office for Europe; 2010 http: www.euro.who.int __data assets pdf_file 0004 127525 e94499.pdf?ua=1.
7. egido-Quigley H, McKee M, Nolte E, Glinos I. Assuring the quality of health care in the European Union. Geneva: World Health Organization; 2008 (Observatory Studies Series No. 12; http: www.euro.who.int __data assets pdf_file 0007 98233 E91397.pdf?ua=1.
8. Jensen BB, Currie C, Dyson A, Eisenstadt N and Melhuish E. Early years, family and education task group: report. Review of social determinants of health and the health divide in the WHO European Region. Copenhagen: WHO Regional Office for Europe; 2013 https: iris.who.int bitstream handle 10665 344815 9789289000567-eng.pdf?sequence=1
9. Closing the gap in a generation: health equity through action on the social determinants of health. Final report of the commission on social determinants of health. Geneva: World Health Organization; 2008 (https: apps.who.int iris bitstream handle 10665 43943 9789241563703_eng.pdf?sequen ce=1.
10. Kruglanski, A.W., Prilleltensky, I., Raviv, A. (Eds.). (2025). The Routledge International Handbook of Human Significance and Mattering (1st ed.). Routledge. https: doi.org 10.4324 9781003424437
11. Wilkinson RG, Pickett KE. Income inequality and social dysfunction. Annu Rev Sociol.2009;35:493–511. doi: 10.1146 annurev-soc-070308-115926.
12. Rocco , Suhrcke M. Is social capital good for health? A European perspective. Copenhagen: WHO Regional Office for Europe; 2012 http: www.euro.who.int __data assets pdf_file 0005 170078 Is-Social-Capital-good-for- your-health.pdf?ua=1.
13. Braubach M, Jacobs D, Ormandy D. Environmental burden of disease associated with inadequate housing: a method guide to the quantification of health effects of selected housing risks in the WHO European Region. Copenhagen: WHO Regional Office for Europe; 2011 http: www.euro.who.int __data assets pdf_file 0017 145511 e95004sum.pdf?ua=1.
14. Friedli . Mental health, resilience and inequalities. Copenhagen: WHO Regional Office for Europe; 2009 http: www.euro.who.int __data assets pdf_file 0012 100821 E92227.pdf?ua=1.
15. Bell R. Psychosocial pathways and health outcomes: informing action on health inequalities. ondon: UC Institute of Health Equity; 2017 http: www.instituteofhealthequity.org resourcesreports psychosocial-pathways-and- health-outcomes-informing-action-on-health-inequalities psychosocial-pathways-and- health-outcomes.pdf.
16. Siegrist J, Rosskam E, eka S. Work and worklessness: final report of the task group on employment and working conditions, including occupation, unemployment and migrant workers. Review of social determinants of health and the health divide in the WHO European Region. Copenhagen: WHO Regional Office for Europe; 2016 (http: www.euro.who.int __data assets pdf_file 0004 334354 EWC-task-report.pdf?ua=1.
17. Baker P, Hone T, Reeves A, Avendano M, Millet C. Does government expenditure reduce inequalities in infant mortality rates in low- and middle-income countries? A time- series, ecological analysis of 48 countries from 199 to 2013. Health Econ Policy aw. 2019;14(2):249–73.doi: 10.1017 S1744133118000269
18. What matters most for early childhood development: a framework paper. Washington (DC): World Bank; 2013 (SABER Working Paper Series No. 5; http: documents.worldbank.org curated en 359991468331202884 pdf 901830NWP0no500 0Box385307B00PUB IC0.pdf.
19. World report on ageing and health. Geneva: World Health Organization; 2015 (https: apps.who.int iris bitstream handle 10665 186463 9789240694811_eng.pdf?seque nce=1.
Annex 1. Methods to derive indicators
A1.1 Selection of indicators
Indicators were selected for inclusion in the 2nd Health Equity Status Report (HESRi2) Dataset to provide a pragmatic set of measures that were based on accessible data and cover health equity status and policy progress across the five underlying conditions of health equity: Health Services, Social and Human Capital iving Conditions, Employment and Working Conditions and Income Security and Social Protection. Certain key criteria were considered in selecting indicators, in consultation with the Scientific Expert Advisory Group and the HESRi2 Country Partners Group.
The HESRi2 aimed to include indicators that:
• clearly related to priority areas for action on health equity for which there is a clear evidence base and reflected in the WHO Euro Health Equity Policy Tool;
• related to areas of action in which Member States have already made commitments;
• were relevant to the full range of country contexts across the WHO European Region;
• provided a balance of measures across the five underlying conditions for health equity;
• provided as much coverage of countries across the Region, consistent with ensuring a good representation of inequalities in countries that do not provide data to the Statistical Office of the European Union (i.e. to Eurostat);
• used data recoded on international or intranational databases that had been collected though consistent processes across countries in order to support more reliable comparisons;
• used data that could be disaggregated by socioeconomic status, or that were related to policies and expenditure known to have an impact on health inequities;
• used openly accessible data from international datasets, which could be feasibly collected and analysed given the available timescale and resources;
• used data that were reasonably current and that could be updated to track trends.
Initial, the list of 108 HESRi1indicators were reviewed, to assess the feasibility of updating them. New indicators were added, either to replace those that could not be updated or to address topics that were in scope, but not covered in HESRi1. This process was reviewed by the Scientific Expert Advisory Group and the HESRi2 Country Partners Group and through
wide consultation against the criteria listed above; as a result,122 indicators were selected for inclusion in the Health Equity Dataset.
A1.2 Data sources
Data from several sources were used to derive the indicators featured in the Health Equity Dataset. Data were obtained from sources such as household and other population-based surveys, administrative and financial data systems and surveillance systems. Where obtainable, publicly available data were used. For example, a number of indicators were derived from datasets containing national-level data published by the Organisation for Economic Cooperation and Development (OECD), World Bank, International abour Organization I O), United Nations Children’s Fund (UNICEF), Food and Agriculture Organization (FAO), International Monetary Fund (IMF), World Value Survey (WVS), Global Data ab (GD ), Global Burden of Disease (GBD), European Institute for Gender Equality (EIGE), World Justice Project, and the Eurostat database from the Statistical Office of the EU. Eurostat data were obtained through a data-sharing agreement (RPP 85 2018- FS-EU-SI C- EHIS). The responsibility for all conclusions drawn from the data lies entirely with the authors.
Where data were not publicly available, survey microdata, which contained information available at the individual level, were used to derive indicators. Official requests were made to access survey microdata, using (for example) the European Union Statistics on Income and iving Conditions instrument (EU-SI C), the WHO STEPwise approach to Surveillance (STEPS) tool, and the European Health Interview Survey (EHIS; included in the list below). Empirical data collected from these nationally representative surveys, among others, were compiled and processed to create indicators.
Details of each of the databases, surveys and other sources used and the acronyms used for them in this document are listed below.
Acronym Database/survey details EHIS European Health Interview Survey [online database]. Luxembourg:
Statistical Office of the European Union (Eurostat) (https://ec.europa.eu/eurostat/web/microdata/european-health- interview-survey).
EQLS European Quality of Life Surveys (https://www.eurofound.europa.eu/surveys/european-quality-of- lifesurveys). European Foundation for the Improvement of Living and Working Conditions (Eurofound). European Quality of Life Survey integrated data file, 2003–2016 (data collection). 3rd Edition. Colchester: UK Data Service; 2018 (SN: 7348) http://doi.org/10.5255/UKDA-SN-7348- 3).
ESS European Social Survey (http://www.europeansocialsurvey.org/). ESS Cumulative Data Wizard, ESS 1-8. Data file edition 1.0. Bergen: Norwegian Centre for Research Data; 2018 (doi:10.21338/NSD-ESS- CUMULATIVE).
EU-LFS European Union Labour Force Survey [website]. Data and publication. Luxembourg: Statistical Office of the European Union (Eurostat) (https://ec.europa.eu/eurostat/statistics- explained/index.php/EU_labour_force_survey_%E2%80%93_data_and_p ublication).
Eurostat Eurostat [online database]. Luxembourg: Statistical Office of the European Union (http://ec.europa.eu/eurostat/data/database).
EU-SILC European Union Statistics on Income and Living Conditions [online database]. Luxembourg: Statistical Office of the European Union (Eurostat) (http://ec.europa.eu/eurostat/web/microdata/europeanunion- statistics-on-income-and-living-conditions).
EWCS European Working Conditions Survey (https://www.eurofound.europa.eu/surveys/european- workingconditions-surveys). Eurofound. European Working Conditions Survey integrated data file, 1991–2015 (data collection). 7th Edition. Colchester: UK Data Service; 2018 (SN: 7363) (http://doi.org/10.5255/UKDASN-7363-7).
GBD Global Burden of Disease Collaborative Network [online database]. Seattle (WA): Institute for Health Metrics and Evaluation (IHME) (http://ghdx.healthdata.org/organizations/global-burden- diseasecollaborative-network).
GDL Global Data Lab [online database]. Nijmegen: Raboud University Institute for Management Research (https://globaldatalab.org/).
HBSC Health Behaviour in School-aged Children [online database]. Bergen: HSBC Data Management Centre (https://www.uib.no/en/hbscdata).
ILO ILOSTAT [online database]. Statistics of the International Labour Organization. Geneva: International Labour Organization (http://www.ilo.org/ilostat/).
MICS Multiple Indicator Cluster Surveys [online database]. New York (NY): United Nations Children’s Fund (http: mics.unicef.org surveys).
OECD OECD. Stat data warehouse [online database]. Paris: Organisation for Economic Co-operation and Development (https://stats.oecd.org/).
PISA OECD PISA [online database]. Programme for International Student Assessment. Paris: Organisation for Economic Co-operation and Development (http://www.oecd.org/pisa/data/).
STEPS WHO STEPwise approach to Surveillance [website]. Geneva: World Health Organization (https://www.who.int/ncds/surveillance/steps/en/).
UNICEF UNICEF data [online database]. New York (NY): United Nations Children’s Fund (https://data.unicef.org).
WHO EHIG
European Health Information Gateway [online database]. Copenhagen: WHO Regional Office for Europe (https://gateway.euro.who.int/en/).
WHO GHED
WHO Global Health Expenditure Database [online database]. Geneva: World Health Organization (https://apps.who.int/nha/database).
WHO GHO
WHO Global Health Observatory data repository [online database]. Geneva: World Health Organization (http://www.who.int/gho/en/).
WHO UNICEF
WHO/UNICEF Joint Monitoring Programme (JMP) for Water Supply, Sanitation and Hygiene [online database]. Geneva: World Health Organization and United Nations Children’s Fund (https://washdata.org/data).
UN IGME
UN Inter-agency Group for Child Mortality Estimation (https://data.unicef.org/resources/un-inter-agency-group-for-child- mortality-estimation-unigme/)
WJP World Justice Project Rule of Law Index [online database]. Washington (DC): World Justice Project (https://worldjusticeproject.org/our- work/wjp-rule-law-index).
World Bank
World Bank Data Catalogue [online database]. Washington (DC): The World Bank Group (https://data.worldbank.org/data-catalog).
WVS Inglehart, R., C. Haerpfer, A. Moreno, C. Welzel, K. Kizilova, J. Diez- Medrano, M. Lagos, P. Norris, E. Ponarin & B. Puranen (eds.). 2022. World Values Survey: All Rounds - Country-Pooled Datafile. Madrid, Spain & Vienna, Austria: JD Systems Institute & WVSA Secretariat. Dataset Version 3.0.0. doi:10.14281/18241.17
A1.3 Data processing
Following data collection, individual datasets containing primary data were stored in a secure data warehouse for processing. In order to maximize country coverage, indicators were created by combining datasets from different sources, if comparable data were available. Data processing involved, where necessary, data cleaning and suppression of implausible values and cells based on small samples (counts of <50 respondents). Data were aggregated by country and year, as well as characteristics such as sex, age group, education level and income, using survey weights where available to adjust for sampling errors and biases. To facilitate comparison between countries with different age profiles, health outcome indicators were directly age standardized with the WHO World Standard Population. For some analyses, countries were aggregated by geographical region, as follows: Caucasus, central Asia, central Europe, Nordic countries, Russian Federation, South-eastern Europe western Balkans, southern Europe and western Europe (see Annex 3).
For the majority of indicators, income quintiles were calculated based on equivalized disposable household income. Where possible, levels of education were based on the International Standard Classification of Education (ISCED) 2011, or the earlier classification, ISCED 1997. The ISCED educational levels are often aggregated to form a three-category education variable, with: (1) low-level education, which is pre-primary to lower secondary education only; (2) mid-level education, which represents upper-secondary to post- secondary nontertiary education; and (3) high-level education, which is tertiary education. Indicators within HESRi2 were disaggregated by this three-category variable for educational level, where available. Where an indicator is not disaggregated by either income or education, but is available for regions within a country, these regions are grouped by income per capita. Although poorer regions tend to have worse outcomes than richer ones this is not always the case because other factors may affect regional differences in some countries (e.g. the urban rural composition of regions).
Data processing was conducted using R statistical software (version 3.4.3). A panel of regional experts, scientific advisors and members of international organizations approved the methods used and the interpretation of the indicators, prior to publication.
The primary equity measure derived was the absolute difference between the most and least disadvantaged groups (e.g. based on education or income). The trend indicators are based on the (linear) slope index of inequality to calculate an annual rate of change, as well as statistical significance. They use all available data for the indicator since 2010 to calculate the trend. Trends were assessed as increasing if the linear trend across all the data points available was significantly greater than 0 (p<0.1) or decreasing if the linear trend across all the data points available was significantly lower than 0 (p<0.1); otherwise, the trend was labelled as having no noticeable change.
A1.4 Limitations
Certain limitations need to be taken into account when interpreting the indicators and users should refer to the original source documentation to assess the quality of the data collection and measurement methods.
Differences in methodologies – such as the extent to which samples are representative of populations – and differences in survey instruments and definitions may limit the comparisons that can be made between countries and within countries over time. Individuals from lower socioeconomic groups are often underrepresented in population- based surveys, which may limit generalizability. Additionally, self-reported outcomes may be influenced by response biases and cultural differences, and, when comparing countries with diverse health services, differences in self-reported health outcomes may reflect access to care, rather than real differences in morbidity.
Whilst every effort has been made to achieve as much coverage of countries across the Region as possible, consistent with ensuring a good representation of inequalities in countries not providing data to Eurostat , only 17of the selected indicators cover 50 or more of the countries in the WHO European Region. This highlights the need for a coordinated approach to monitoring health equity within the Region going forward.
Annex 2. Modelling
A2.1 Decomposition analysis
Demanding microdata requirements for the decomposition analysis means that this analysis is only possible for inequities in a select number of health indicators.
Decompositions of contributors to self-reported health, limiting illness, mental health and life satisfaction are possible using microdata from ESS and EUSI C for 32 countries in the WHO European Region, consisting of the 27 EU countries, Iceland, Norway, Serbia, Switzerland, and the United Kingdom. There is sufficient data for underlying conditions in all five areas to be analysed, showing that differences in conditions in all five areas are statistically significant in explaining inequities in these health indicators (Fig. 2.2).
A2.2 Technical details of the decomposition method
The idea behind the decomposition analysis is to explain the differences in health indicators that were observed between socioeconomic groups in Section 1 by a set of contributing factors that differ systematically between these groups.
This helps to understand the multisectoral conditions behind why health inequities exist between groups of people within countries, even when effective health services are in place that aim to narrow or eliminate inequities in health and health care. For example, differences in health may be explained by differences in housing conditions and working conditions, as well as by differences in quality of health care. Even if countries are able to narrow inequities in one factor, inequities may still remain in others, emphasizing the importance of taking a multisectoral approach to tackling health inequity.
The decomposition analysis reveals the extent to which each factor contributes to health inequities compared to each of the other factors. The method used in the Health Equity Status Report (HESR) is a simulation-based decomposition that relies on coefficients from a single, pooled regression model, a principle related to the variant of the Oaxaca decomposition method proposed by Neumark (1) and Oaxaca Ransom (2). The decomposition is based on regression analysis of the relationships between self-reported health and the indicators of underlying conditions. It should be noted that while this analysis provides an explanation of health inequity in terms of statistical associations, the regression model used does not constitute a causal analysis and therefore the results should not be interpreted as a stand-alone guide to policy – the decomposition results should be interpreted with care and only in context with other evidence.
The analysis first quantifies the overall health inequality by calculating a health gradient, in this case the Slope Index of Inequality. The decomposition then proceeds through a counterfactual simulation for each underlying condition. To determine the contribution of a single factor (e.g. employment), we simulate a scenario where that factor is set to its optimal value for all individuals in the population. By predicting health outcomes in this simulated scenario and recalculating the health gradient, we can measure how much the overall inequality is reduced. This reduction is considered the contribution of that specific factor to the total health gap.
A2.3 Equity Tracker
he ineq ali y index in he eq i y racker wa calc la ed in he followin way: i. for ho e indica or ha are di a re a ed by ocioeconomic a :
a. he lope index i calc la ed acro ocioeconomic ro p b. where here are m ltiple mea re of ocioeconomic a ch a ed cation and income, a
in le compo i e ocioeconomic rank i fir crea ed by avera in he e variable , and hen ed o calc la e he lope index
ii. he mea re calc la ed in ep (i) i andardized by cen erin i on he mean for all co n rie and dividin by i andard deviation. In hi way, he me ric ed i mea red in andard deviation .
Where he indica or i no di a re a ed by ocioeconomic a b ha an obvio relation hip wi h ineq ali y direc ly (e. . pover y ra e , Gini), he e were j andardized a (ii) above. nn al mea re were e tima ed for each indica or. da a may be mi in for ome year for differen co n rie and differen indica or , we moo h o da a be ween year by:
i. akin he 3-year movin avera e for each indica or ii. E timatin mi in year by akin he linear rend be ween non-mi in year of da a wi hin
co n rie or ro p of indica or ( ch a each of he five e ential condition ), he andardized mea re for each indica or were hen combined acro indica or ca e orie , by akin he avera e for all non-mi in andardized indica or in each ro p for each co n ry. imilar approach wa ed o avera e acro ro p of year . inally, o crea e he - o- index een in he racker , he e contin o domain core are conver ed in o q intile . Wi hin each domain, all co n rie are ranked by heir core and divided in o five eq al ro p , wi h ' ' repre entin he lowe ineq ali y and ' ' repre entin he hi he ineq ali y.
A .4 m g w g m q w g q g . This is produced by taking the annual measures of the standardized indicators over the years 2010-2023, as derived in A2.3 and fitting a linear regression model with country fixed effects. This estimates the extent to which change in equity in each of the conditions over time within a country is associated with change in equity in self-reported health (based on the standardized slope index as in A2.3). The model also includes sex and year as control
variables to account for average differences between sexes and for underlying linear time trends. For all indicators in the chart a reduction in equity in conditions is independently associated with a reduction in health equity (and vice versa). A .5 M g ff m m .
This is based on a logistic regression model with the outcome measure, such as poor health, social isolation measured as a binary outcome (e.g. poor health vs. not poor health), controlling for sex, age, age squared and age-sex interactions. The intervention is measured as a three-way interaction between the country’s pension coverage, the standardized expenditure per pension recipients and an indicator of whether a respondent is over the country’s effective pension age for that year. This model is then used to simulate how the outcome changes, within each sex and income quintile. The simulation specifically models the effect of a best-practice scenario (i.e. pension coverage at the maximum observed level and expenditure at least at the European average) to estimate the potential impact on population health and well-being. A .6 H w b m g k b
m k x .
) L m g
First, the percent of 16–24-year-olds who report a limiting illness for each educational group for each country and year is combined with I O data on the percent (in each education group for each country and year) who are not in education, employment or training (NEET). This is used in a linear regression model with percent NEET as the outcome and the one to three- year lagged values of limiting illness as the exposure with country fixed effects. The coefficients for each lagged year are combined to estimate the effect of the cumulative trending limiting illness, over three years, on NEET. A comparable analysis is then performed using youth unemployment as the outcome variable in place of NEET. ) D
As there are only two time points for this indicator, a simpler approach is used. The difference between the two time points in depression prevalence for each country and the difference in the two labour market outcomes, NEET prevalence and youth unemployment, for each country are calculated. Then, to estimate the association, two separate regression models are fitted. In the first model, the change in the NEET rate is regressed on the change in depression. In the second, the change in youth unemployment is regressed on the change in depression.
Annex 3. Country clusters
Member States have been grouped according to policy and political commonalities. The clusters also aim to reflect the countries that Member States compare themselves to. This grouping does not coincide with preexisting WHO country groupings.
Country Cluster
Annex 4 List of HESRi Database indicators
Indicator title Indicator definition Data sources
Latest year
Health status Morbidity Alcohol consumption Percentage of adults aged 18-64 years who drink
alcohol daily (age adjusted) STEPS EHIS 2023
Alcohol consumption (risky single occasion drinking)
Percentage of adults aged 18-64 years engaging in risky single occasion drinking at least once a month (age adjusted)
STEPS EHIS 2023
Children reporting multiple health complaints
Percentage of children aged 11-15 experiencing two or more health complaints weekly
HBSC 2022
DALYs due to occupational exposure
DALYs attributable to occupational risks and exposures (age standardized rate per 100,000)
GBD 2021
Limitations in activities of daily living
Percentage of adults reporting limitations in daily activities due to health problems
EU-SILC ESS 2024
Obesity/Overweight Percentage of adults aged 18-64 years who are obese (age adjusted)
STEPS EHIS 2023
Prevalence of self- reported CVD
Percentage of adults aged 18-64 years reporting cardiovascular disease (age adjusted)
STEPS EHIS 2023
Prevalence of self- reported diabetes
Percentage of adults aged 18-64 years reporting diabetes (age adjusted)
STEPS EHIS 2023
Serious injuries in children Percentage of children aged 11-15 having required medical treatment for 3 or more injuries in past year
HBSC 2018
Smoking Percentage of adults aged 18-64 years who are current smokers
STEPS EHIS 2023
Mortality
Infant mortality rate Infant mortality rate for children aged less than 1 year (per 1000 live births)
World Bank Eurostat GDL
2019
Life expectancy at birth Life expectancy at birth in years GDL 2022
Tuberculosis mortality Age-standardized tuberculosis death rate per 100,000 population
WHO 2022
Under-five mortality rate
Under-five mortality rate (per 1000 live births) UN IGCME 2022
Wellbeing
Adult life satisfaction Percentage of adults reporting poor life satisfaction
ESS WVS 2023
Adult self-reported health
Percentage of adults reporting poor or fair health
EU-SILC ESS WVS
2024
Center for Epidemiological Studies Depression Score (CES- D8)
Proportion of people at high risk of clinical depression
ESS 2014
Children pressured by schoolwork
Percentage of children aged 11-15 reporting being pressured by schoolwork
HBSC 2022
Children's life satisfaction
Percentage of children aged 11-15 years reporting poor life satisfaction
HBSC PISA 2022
Children's self-reported health
Percentage of children aged 11-15 years reporting poor or fair health
HBSC 2022
Physical inactivity in children
Percentage of children aged 15 years who are physically active
PISA 2022
Problematic social media use in children
Percentage of children aged 11-15 showing symptoms of social media disorder
HBSC 2022
Self-reported work- related health condition
Percentage of adults aged 15-64 years reporting a work-related health problem (age adjusted)
EU-LFS via Eurostat
2020
Health services
Access to health care
Avoidable hospital admissions
Number of avoidable hospital admissions per 100,000 people
Eurostat GDL
2021
Cancer screening (cervical) Percentage of women reporting ever having a cervical cancer screening
STEPS EHIS
2023
Hospital beds Available hospital beds per 100,000 inhabitants
Eurostat OECD GDL
2022
Informal care Percentage of those aged 18-64 years who provide informal care for people with disabilities at least once a week (age adjusted)
EHIS 2019
People with diabetes treated Percentage of people aged 18-64 with diabetes who are receiving treatment
STEPS 2023
People with hypertension treated
Percentage of people aged 18-64 with hypertension who are receiving treatment
STEPS 2023
Physicians or doctors Number of physicians or doctors per 100,000 inhabitants
Eurostat OECD GDL
2022
Public expenditure on health Current health expenditure as a percentage of GDP
WHO 2023
Public expenditure on long- term care
Total expenditure on long-term care as a percentage of GDP
Eurostat OECD
2023
Public spending on public health services
General government expenditure on public health services as a percentage of GDP
IMF Eurostat OECD
2023
Self-reported unmet needs for health care
Percentage of people reporting unmet needs for health care
EU-SILC WVS
2024
Financial protection for health
Household out-of-pocket payments on long-term care
Household out-of-pocket payments on long- term care as a percentage of GDP
OECD 2023
Households with catastrophic health spending
Percentage of households with out-of-pocket payments that are greater than 40% of their capacity to pay for health care
WHO Barcelona Office
2022
Households with impoverishing health spending
Percentage of households that are impoverished or further impoverished after out-of-pocket payments
WHO Barcelona Office
2022
Out-of-pocket expenses Out-of-pocket expenses as a percentage of current health expenditure
WHO 2023
Social and human capital
Human capital
Adult literacy rate Percentage of adults aged 15+ years who are literate
UNESCO via World Bank
2023
Children developmentally on track
Percentage of children aged 36-59 months who are developmentally on track
MICS 2019
Children/youth minimally proficient in reading and maths
Percentage of children aged 15 years achieving minimum proficiency in mathematics and reading
PISA 2022
Government expenditure on early childhood education
Government expenditure on early childhood education in purchasing power standards (PPS) per child under 5 years of age
Eurostat 2021
Participation in early childhood education
Percentage of children aged 36 to 59 months participating in early childhood education
UNICEF Eurostat
2022
Participation in education and training
Percentage of adults aged 25-64 years participating in formal and non-formal education and training
Eurostat 2023
Young people not in employment/education/training
Percentage of young people who are not in employment, education or training
ILO Eurostat
2023
Social Capital
Children's exposure to Bullying Percentage of children aged 11-15 reporting being bullied in school 2-3 times a month
HBSC 2022
Children's exposure to Cyberbullying
Percentage of children aged 11-15 reporting being cyberbullied 1-2 times a month
HBSC 2022
Equal treatment under the law and absence of discrimination
Score from 0-1 on the World Justice Project Rule of Law Index measuring equal treatment under the law and absence of discrimination
World Justice Project
2024
Freedom of choice and control over life
Percentage of people aged 18+ years reporting low levels of freedom of choice and control over their own life
WVS 2022
Frequency of meeting socially Percentage of people aged 16+ years who meet with family/friends less than once a month
EU-SILC ESS
2023
Gender Equality Index Score from 1-100 on the Gender Equality Index
EIGE 2024
Having someone to ask for help Percentage of people aged 16+ years who don't have someone to ask for help
EU-SILC 2022
Participation in voluntary activities
Percentage of people aged 16+ years participating in formal voluntary activities
EU-SILC 2022
Perceived ability to influence politics
Percentage of people aged 18+ years reporting having no ability to influence politics
ESS 2023
Self-reported social support in young people
Percentage of children aged 11-15 years reporting low peer support
HBSC 2022
Social Institutions and Gender Index
Score from 0-100 on the Social Institutions and Gender Index
OECD 2023
Trust in others Percentage of adults aged 18+ years reporting low trust in other people
ESS WVS 2023
Trust in politicians Percentage of people aged 16+ years reporting low levels of trust in politicians
ESS 2023
Living environment
Commercial determinants
Daily breakfast consumption in schoolchildren
Percentage of children aged 11-15 missing breakfast on any schoolday
HBSC 2022
Food insecurity Percentage of people who cannot afford to eat an adequate meal
EU-SILC WVS
2023
Food Price Index Food Price Index (2017=100) Eurostat World Bank
2025
Moderate or severe food insecurity
Percentage of the population experiencing moderate or severe food insecurity (3-year average)
FAO 2022
Tobacco tax Tobacco taxes as a percentage of price of the most sold brand
WHO 2022
Value-added tax (VAT) on alcohol
Value-added tax (VAT) on alcohol WHO 2019
Digital environment
Internet use Percentage of people aged 16+ years who never use the internet
ESS WVS 2023
Environment
Annual mean PM10 concentrations
Annual mean concentration of PM10 in cities WHO 2022
Annual PM2.5 emissions Total annual PM2.5 emissions (ton) GDL 2022
DALYs due to air pollution DALYs attributable to air pollution (age standardized rate per 100,000)
GBD 2021
Diesel cars Diesel powered passenger cars as a percentage of all registered passenger cars
Eurostat 2023
Feeling unsafe from crime in own home
Percentage of adults aged 18+ years feeling unsafe from crime in their own home
WVS 2022
Feeling unsafe walking alone after dark
Percentage of adults feeling unsafe when walking alone in their area after dark
ESS 2023
Intentional homicide Intentional homicide by intimate partner or family member, victims per 100,000 population
Eurostat 2023
Neighbourhood security Percentage of people aged 16+ years who don't feel secure living in their neighbourhood
WVS 2023
Physical violence in children Percentage of children aged 11-15 reporting having been in 3 or more physical fights in past year
HBSC 2018
Pollution/grime/other environmental problems
Percentage of people reporting pollution, grime or other environmental problems in their area
EU-SILC 2023
Public spending on housing and community amenities
General government expenditure on housing and community amenities as a percentage of GDP
IMF Eurostat OECD
2023
Reported crime, violence and vandalism
Percentage of people aged 16+ years reporting local problems with crime, violence or vandalism
EU-SILC 2023
Road deaths Estimated road traffic deaths per 100,000 population
WHO 2019
Housing
Basic drinking water services Percentage of people without at least basic drinking water services (an improved source within a 30 minute round trip to collect water)
WHO UNICEF
2022
Basic sanitation services Percentage of people without at least basic sanitation services (improved sanitation facilities that are not shared with other households)
WHO UNICEF
2022
DALYs due to unsafe sanitation
DALYs attributable to unsafe sanitation (age standardized rate per 100,000)
GBD 2021
Households receiving housing allowance
Percentage of households receiving housing allowance
OECD 2022
Housing cost overburden rate Percentage of people living in a household where housing costs are more than 40% of disposable household income (net of housing allowances)
EU-SILC 2023
Housing overcrowding Percentage of people living in an overcrowded dwelling
EU-SILC 2023
Inability to adequately heat home
Percentage of people who cannot afford to keep their home adequately warm
EU-SILC 2023
Severe housing deprivation rate
Percentage of people living in an overcrowded dwelling that also lacks a bath and indoor toilet, or is damp or too dark
EU-SILC 2023
Employment and working conditions
Job security
Employment rate Percentage of those in employment among those aged 16-64 years
EU-SILC ESS WVS
Labour force participation rate
Percentage of the population either working or looking for work
ILO 2024
Proportion of the poorest quintile population covered by labour market programs
Percentage of the poorest quintile in the population covered by unemployment benefits and active labor market programs
World Bank
2020
Public expenditure on labour market policies
Public expenditure on labour market programmes (active and passive) as a percentage of GDP
OECD 2022
Redundancy pay at 2 years of tenure, in months
Number of months of redundancy pay at two years of job tenure
ILO 2020
Temporary employees Temporary employees as percentage of the total number of employees aged 20-64 years
Eurostat 2023
Unemployment benefit coverage
Percentage of unemployed persons receiving regular periodic social security unemployment benefits
ILO 2023
Unemployment rate Percentage of unemployed persons in the labour force
ILO 2024
Working conditions
Accidents at work Percentage of workers aged 15-64 years reporting at least one non-fatal accident at work in the past 12 months
EULFS via Eurostat
2020
Average wages/earnings Average nominal monthly earnings of employees in 2021 USD PPP
ILO 2023
Collective bargaining coverage
Percentage of employees whose pay and/or conditions of employment are determined by one or more collective agreements
ILO 2020
Disability employment ratio Ratio of employment rates between people without disabilities and people with disabilities, aged 16-64 years
EU-SILC 2023
Feeling about household's income
Percentage of people aged 16+ years reporting difficulties living on their household's income
ESS 2023
Gone without cash income Percentage of people aged 16+ years reporting they sometimes or often have to get by without an income
WVS 2022
In-work poverty Percentage of employed persons aged 18+ years with income below 60% of median equivalised disposable income (after social transfers)
EU-SILC 2023
Labour inspectors Average number of labour inspectors per 10,000 employed persons
ILO 2023
Labour share of GDP (wages and social protection transfers)
Percentage of GDP allocated to labour compensation, comprising wages and social protection transfers
ILO 2024
Low financial satisfaction Percentage of people aged 16+ years reporting low levels of satisfaction with the financial situation of their household
WVS
Low job control Percentage of the population aged 16-64 years, reporting low levels of control over how their daily work is organised
ESS
Minimum wage Statutory nominal gross monthly minimum wage in constant 2021 USD PPP
ILO 2024
Working excessive hours Percentage of workers working 40+ hours per week
ILO 2024
Working excessive hours (more than 45 hours per week)
Percentage of the population aged 16-64 years, working more than 45 hours per week
ESS
Income security and social protection Poverty and inequality
Adequacy of social assistance programmes
Social assistance transfers received by beneficiaries as a percentage of their total income or consumption
World Bank
2021
Coverage of social assistance programmes
Percentage of the population participating in social assistance programs
World Bank
2021
Disability poverty ratio Ratio of poverty rates (percentage below 60% of median income) between people with disabilities and people without disabilities, aged 16-64 years
EU-SILC 2023
Gini index Gini index of income inequality from 0-100 World Bank
2022
Incidence of social assistance programmes
Social assistance program beneficiaries in each income quintile as a percentage of total number of social assistance program beneficiaries
World Bank
2021
Poverty Percentage of the population with income below 60% of median equivalised disposable income (EUSILC) or national poverty lines (World Bank)
EU-SILC World Bank
2024
Public spending on social protection
General government expenditure on social protection as a percentage of GDP
IMF Eurostat OECD
2023
Public spending on social protection for children and families
General government expenditure on social protection for children and families, as a percentage of GDP
Eurostat 2023
Public spending on social protection for sickness and disability
General government expenditure on social protection for sickness and disability, as a percentage of GDP
Eurostat 2023
Public spending on social protection for unemployment
General government expenditure on social protection for unemployment, as a percentage of GDP
Eurostat 2023
Risk of child poverty Percentage of children aged 0-18 at risk of poverty or social exclusion
Eurostat 2024
Vulnerable people covered by social assistance programmes
Percentage of poor persons covered by social protection systems
ILO 2023
Supporting older people Pension coverage Percentage of the population above statutory
pensionable age receiving an old age pension ILO 2023
Pension expenditure per beneficiary
Annual pension expenditure per beneficiary for old-age pensions in purchasing power standards (PPS)
Eurostat 2022
Pension net replacement rate
Individual net pension entitlement as a percentage of net pre-retirement earnings
OECD 2022
Supporting parenting
Length of paid maternity and parental leave
Length of paid maternity and parental leave available to mothers in weeks
OECD 2021
Length of paid paternity and parental leave
Length of paid paternity and parental leave available for fathers in weeks
OECD 2021
Maternity benefits Percentage of women giving birth receiving maternity cash benefits
ILO 2023
Annex references
1. Neumark D. Employers’ discriminatory behavior and the estimation of wage discrimination. J Hu Resour. 1988;23(3):279–295 (https: doi.org 10.2307 145830, accessed 1 April 2019).
2. Oaxaca R , Ransom MR. On discrimination and the decomposition of wage differentials. J Econom. 1994;61(1):5–21 (https: doi.org 10.1016 0304-4076(94)90074-4, accessed 1 April 2019).
3. Hendramoorthy M, Kupek E, Petrou S. Self-reported health and socio-economic inequalities in England, 1996–2009: Repeated national cross-sectional study. Soc Sci Med. 2015;136–137: 135–146 (https: doi.org 10.1016 j.socscimed.2015.05.026, accessed 1 April 2019).
4. Health at a glance: Europe 2016. State of health in the EU cycle. Paris: Organisation for Economic Cooperation and Development; 2016 (https: www.oecd- ilibrary.org docserver 9789264265592- en.pdf?expires=1544454583 id=id accname=guest checksum=7B817E65B, accessed 1 April 2019).
5. Subramanian V, Huijts T, Avendano M. Self-reported health assessments in the 2002 World Health Survey: how do they correlate with education? Bull World Health Organ. 2009;88(2):131–138.
6. Functional and activity limitations statistics [website]. uxembourg: Statistical Office of the European Union; 2017 (https: ec.europa.eu eurostat statistics- xplained index.php Functional_and_activity_limitations_statistics, accessed 1 April 2019).
7. Brown C, Harrison D, Burns H, Ziglio E. Governance for health equity: taking forward the equity values and goals of Health 2020 in the WHO European Region. Copenhagen: WHO Regional Office for Europe; 2014 (http: www.euro.who.int en publications abstracts governance-for-health-equity, accessed 1 April 2019).
8. OECD guidelines on measuring subjective well-being. Paris: Organisation for Economic Co-operation and Development; 2013 (https: www.ncbi.nlm.nih.gov books NBK189567 , accessed 1 April 2019).
Tähelepanu! Tegemist on välisvõrgust saabunud kirjaga. |
Message addressed to WHO National Counterparts, WHO National Technical Focal Points for Equity and social determinants of health, WHO Representatives
_____________________________________________________________________________________
Dear Colleague,
In November 2025, the WHO Regional Office for Europe will launch the 2nd European Health Equity Status Report. The Report will provide all countries of the WHO European Region with data-driven insights to support policy actions that address health inequities. Inside the 2nd European Health Equity Status Report there will be a comprehensive analysis of the latest status and trends in health equity and well-being within and across countries of the WHO European Region, together with analysis of the main determinants that underpin these trends.
In light of the major demographic shifts within and across countries in the WHO European Region, the 2nd European Health Equity Status Report will also include a special feature on health equity across the life course with a spotlight on health equity in adolescence and youth and in later life.
A companion product to the 2nd European Health Equity Status Report, is an Interactive Health Equity Atlas. This will go live online with the launch of the report in November 2025. The Atlas contains all the data behind the Report, in an easy to navigate tool that allows policy makers, planners and service providers to make an equity deep dive into their own country, to compare progress and status across more than 120 health equity indicators disaggregated by age, sex and a measure of socioeconomic status and to identify priorities for action. The Data in the Health Equity Atlas can also be exported in a variety of charts that are suitable for preparing reports, presentations, briefings and advocacy purposes.
As part of WHO/Europe’s commitment to transparency and consultation and in advance of the report being launched, I am pleased to share with you a reference document containing the main data sources and the selection of graphs that will feature in the 2nd European Health Equity Status Report. This is not the actual 2nd European Health Equity Status Report but a summary of key graphs, the rationale for why and how indicators were selected and a brief description of the methodology used to undertake the equity analysis and the modelling of status, trends and the association with a range of social determinants.
I would kindly ask you to share this document with relevant colleague responsible for data analysis and for health equity for their information and kind review of the material before we proceed with final publication.
Please send any questions or comments by 28th August. If we don’t receive any feedback or comment from you within this timeframe we will take this as there are no comments to be made.
Thank you in advance for your continued collaboration and support for this important work to support the goal of leaving no one behind due to poor health.
Best Regards,
Chris
Chris Brown
Head
WHO European Office for Investment for Health and Development
Venice, Italy
+39 3475382758
The Second WHO European Health Equity Status Report – 2025
Healthy prosperous lives for all
The purpose of this document is to provide information to Member States to support their review and any comments on the data indicators and graphs that will be included in the 2nd Health Equity Status Report that will be launched in November 2025.
Introduction
The WHO European Health Equity Status Report initiative (HESRi), launched in 2019, provides data-driven insights to support policy actions that address health inequities (1).
Since its launch the work has inspired local and national authorities to strengthen their health equity policies, has informed the work of international bodies (EU institutions and agencies, OECD), and has been a catalyst for new alliances across countries and communities of practice. The work has spearheaded political commitments and the creation of practical resources to drive action on health equity and well-being – enabling governments and health authorities to progress efforts towards creating a healthy life for all.
Continuing this work, WHO Europe is currently preparing a Second Pan European Health Equity Status Report. This will bring together the latest available status and trends in health equity and well-being within and across countries of the WHO European Region.
The second HESRi Report will delve into Health equity across the life course with a spotlight on children and young people and on healthy ageing. This is in the light of major demographic shifts in the age structure of populations within countries in the European Region. The 2nd HESRi report will use innovative techniques to capture health equity status and trends of men and women at different stages across the life course. It will show how these are associated with key features of i) health systems; ii) social relations and participation, education and learning iii) living conditions; iv) employment and work and v) income security, and set out options and solutions for reducing inequities and accelerating progress for healthy and prosperous lives for all, with co-benefits for societies with higher trust and life satisfaction, more resilient public systems and fiscal stability.
Figure 0.1 Essential conditions for a healthy life
The 2nd Health Equity Status Report will be launched in Europe in November 2025
Background
• The 2nd Health Equity Status Report (HESRi2) is a comprehensive review of the status and trends in health inequities and of the essential conditions needed for all to be able to live a healthy life in the WHO European Region.
• Improving health and well-being for all, reducing health inequities and ensuring no one is left behind will bring wider economic, social and environmental benefits to Member States.
• This report seeks to change the common perceptions that health inequity is too complex to address and that it is unclear what actions to take and which policies and approaches will be effective.
• The HESRi2 captures the progress made in implementing a range of policies with a strong effect on reducing inequities and demonstrates the link between levels of investment, coverage and uptake of these policies, as well as the gaps in the essential conditions needed to live a healthy, prosperous life.
• The report will support WHO and Member States to implement the health equity priorities set out in the draft 2nd European Program of Work (EPW2) (2)
Indicators that measure poverty risk, income security and the adequacy and coverage of social protection and welfare policies that
protect health over the life-course
Indicators that measure the health impact of employment and working conditions, including availability, accessibility,
security, wages, physical and mental demands, and exposure to unsafe work
Indicators that measure differential opportunities, access and exposure to living conditions and environmental factors that
impact health and well-being
Indicators of human capital that measure the access availability and affordability of education, learning and literacy;
Indicators of social capital that measure social inclusion exclusion, levels of trust, safety and participation of individuals and communities
in society.
Indicators that measure the availability, accessibility, affordability and quality of prevention, treatment and health-care services
andprogrammes
Health Health Services
Health Social and Human Capital
Health iving Conditions
Health Employment and Working Conditions
Health Income Security and Social
Protection
HESRi2 data
• The HESRi2 analysis and findings are generated from a new dataset. It brings together three types of data (Fig. 0.1) and uses innovations in analytical methodologies to provide a better understanding of health equity, the pathways that generate equity and inequities, and how policy interventions are associated with the rate of progress to reduce gaps in health and well-being, across the countries of the WHO European Region (Annex 1).
• The HESRi2 data and analysis provide the following benefits.
1. Country-specific data allow governments to strengthen decision–making, tailoring their action and investment for health equity accordingly.
2. Analysis supports ministries of health to demonstrate how events and decisions made in other sectors contribute to and interact with inequities in health and well-being.
3. Evidence that enables national and subnational governments and health authorities to improve policy coherence, leading to improved equity in health and in life chances.
F g 0. P g g m H SR
HESRi2 uses a range of data analysis and visualizations to support a robust understanding of the current status of health inequities within countries. It also captures whether there
have been significant reductions or increases in these inequities over a period of 10–15 years (trend analysis data) (Annex 1).
• Gradient charts are used to show the socioeconomic gradient for an indicator, such as self-reported health, by examining how levels of the indicator vary between subgroups of people. Either three or five subgroups are defined according to markers of socioeconomic status - for example, level of education (three groups) (Fig. 0.2), or income or wealth (five groups). For people belonging to each subgroup, the average level of the indicator is calculated and represented in the chart by a different coloured dot.
• Gap and trend charts are used to show the difference, or gap, in average levels of the indicator in the most advantaged subgroup compared to the most disadvantaged subgroup. For example, the charts show the difference between those in the highest and lowest income quintiles or between those with highest level of education (degree-level) and those with least (lower-secondary or below). The traffic light symbols in these figures also show whether the size of the gap for each country has narrowed, widened, or stayed the same over a specified time frame (e.g. Fig 0.3).
• Decomposition charts are used to show how shortcomings in each of the five essential conditions, when combined, contribute to the gap for a given health indicator, such as mental health or limiting illness. The decomposition charts enable policymakers to see more clearly the relative weight of each condition in contributing to (in)equity in a specific health indicator (Annex 2).
• Equity tracker charts show, for each country, a summary outcome for either individual indicators or groups of indicators. The outcomes include the level of inequality or the direction of the trend in inequality. The groups of indicators are the five essential conditions, while the individual indicators are either health outcomes or variables contributing to one of the essential conditions (Annex 2).
Health equity – recent status and trends
1) Health and wellbeing status
Enshrined in the WHO constitution (3) is the principle that “health is a state of complete physical, mental and social well-being and not merely the absence of disease or infirmity.” Underlying this are, among other principles “the enjoyment of the highest attainable standard of health is one of the fundamental rights of every human being without distinction of race, religion, political belief, economic or social condition” and “Governments have a responsibility for the health of their peoples which can be fulfilled only by the provision of adequate health and social measures. In this section of the report, the current status and trends in inequalities in health and wellbeing outcomes within each member state in the European Region are summarized. The graphs likely to be used to illustrate this are shown below. A full list of indicators from which the summary will be drawn is given in Annex 4. The social conditions which give rise to and can be a consequence of the inequities in health and wellbeing are summarized in the section that follows this one.
F g . L x b b b g x, M mb S
F g . P g b m q ,
M mb S
F g .3 P g m
b m b , M mb S
F g .4 C q g
g b m q x, M mb S
2) Essential conditions for health and wellbeing
The analysis presented in the first HESRi report identified the five essential conditions needed to live a healthy life in Europe in the 21st Century as listed in Figure 0.1. This section provides a brief rationale for each of these five conditions and graphs that will be used illustrate status and trends in the indicators related to these conditions. A full list of the HESRi indicators relating to each condition is in Annex 3. Commentary on each condition will draw on a selection of these indicators.
2.1 Health systems
Health systems have a key role in addressing equity in health. Inequities in health will result if the provision of prevention and treatment are unequally distributed in the population – the inverse care law (4). But the health care system can do more than this – it can contribute to the reduction of inequities resulting from social conditions that lead to ill health and a lack of wellbeing. To do both of these, the health system must be universal – providing care for everyone, offering high quality care to all, affordable – ensuring that any out of pocket payments do not place a disproportionate burden on anyone and are responsive to need – do not leave anyone with unmet healthcare needs.
Universal health coverage has an equity impact through ensuring that everyone can use appropriate and effective health services without experiencing financial hardship, irrespective of ability to pay, age, ethnicity, disability, geographical location, race, religion, sex, or sexual orientation. People experience financial hardship when out-of-pocket (OOP) payments are large in relation to their ability to pay for health services. ack of financial protection can lead to or deepen poverty, undermine health, and exacerbate health and socioeconomic inequities. Where health systems fail to provide adequate financial protection, people may be forced to choose between using health services and meeting other basic needs such as food, housing and heating. This has a negative impact on health and well-being, which in turn further increases the risk of socioeconomic vulnerability and exclusion (5). Policies that distribute more resources to areas with greater health, social and economic needs have a positive impact on reducing health gaps between social groups and geographical areas (6).
The quality of health care has an equity impact because health outcomes improve with better quality care (7). Therefore, equitable provision of good quality care reduces gaps in outcomes. Differences in the quality of care arise from differences in the geographical distribution of health services in low- and high-income neighbourhoods or other forms of discrimination that result in lower-income households receiving lower-quality care and poorer health outcomes.
Unequal quality of health care is frequently found between providers catering to low- or high-income neighbourhoods and between private and public providers, mirroring inequities in socioeconomic status and health outcomes. Disaggregation by education level, income and sex allows this indicator to monitor equity in the quality of health care received based on socioeconomic status.
F g . C q g
g m b m q x, M mb
S
F g . C q g - - k x
x , M mb S
F g .3 C q g
w g , M mb S
O - - k m g 40
2.2 Social and human capital
Early childhood development lays the foundation for physical and mental health and well- being outcomes throughout the life course (8). Investment that reduces health risks and vulnerability in the prenatal period and early childhood help parents with lower resources give their children a healthy start in life. Equal access to good quality education from an early age has a strong impact on reducing differences in opportunities and risks, which has both direct and indirect impacts on health. Continued access to education and lifelong learning opportunities has a direct effect on promoting social and economic inclusion and mental well-being). It also has indirect effects linked to increased health and social literacy, such as awareness of health risks and behaviours and mediating life chances and the effects of social and economic shocks (8,9).
Mattering - experiences of feeling valued and adding value (10) -is related to positive outcomes when present, and negative results when absent. When people are treated with dignity and respect, the overall sense of mattering and wellbeing increases. When people perceive that they do not matter, their overall wellbeing suffers greatly. This is the case because people have a fundamental need to experience social worth. Meaningful participation in society, trust in others and being able to influence decisions affecting health and life chances have important direct and indirect health effects. They contribute to stronger individual and social resilience and lower levels of morbidity and poor mental health. Exposure to low-trust environments characterized by higher crime rates, social isolation and lack of ability to influence politics and decision-making in society are strongly associated with poor mental health and a higher risk of morbidity (11).
Participatory public services empower people to take control over their lives and the determinants of their own health. Investment in civic participation, reducing crime and generating social connections have positive impacts on the health and well-being of individuals through their engagement with, and trust in, the local community and wider society (6,12).
F g .4 C q g g 6
w m w m / m , M mb
S
F g .5 P g 8 g w
m w b x,
M mb S
2.3 Living conditions
Shelter is a fundamental human need, providing safety, a sense of belonging, peace and security. Poor housing and poor health are inextricably linked. People living in unaffordable, poor-quality or insecure housing are more likely to report poor health and to suffer from a variety of health problems (13,14).
Differences in the quality of the local environment in which people live have an impact on health equity. ow-income households and neighbourhoods are less likely than those who are wealthier to be in, or have access to, safe, health-promoting environments (14). ocal environments that are detrimental to physical health may also generate stress and anxiety, providing an additional link between physical environment and mental health (14,15). Policies that shape geographical planning, construction and management of public spaces can reduce health inequities due to the local environment (6).
Commercial organizations influence all aspects of life and can therefore have either a beneficial or harmful influence on health equity. Marketing and product exposure, to influence the consumption of alcohol, tobacco and food items, affect the risks of noncommunicable diseases and mortality. This has an impact on health equity because commercial influence varies with how well people are educated about the health risks of detrimental consumption behaviours, whether their economic situation and social environment encourage or discourage them from such consumption behaviours and whether they have easy access to healthy alternatives.
F g .6 P g w g
m j b b m q x, M mb S
More han 4 % of di po able ho ehold income (ne of ho in allowance )
2.4 Employment and working conditions
Productive participation in the labor market can have a positive impact on health equity at an individual level - through its effects on material conditions and on life chances – and at a societal level – through creating the macro-economic resources that underpin policies to enable people to prosper. People who have experienced long-term unemployment are at a higher risk of premature mortality. Young people who have experienced long-term unemployment are more likely than those who have not experienced unemployment to report risky health behaviours, at all levels of socioeconomic status.
Good work is an essential requirement for health. Job insecurity, temporary employment and poor or stressful working conditions are associated with poor mental health, self- reported ill health and an increased risk of fatal and non-fatal cardiovascular events. Excessive hours and few contractual rights directly and indirectly contribute to inequities in physical and mental health. Work-related stress follows a social gradient (16).
Systematic differences in exposure to poor working conditions are closely associated with gender norms and the workers’ age and education level. Discrimination in the labour market exists between sexes. socioeconomic and migrant groups, and persons with disabilities. Ensuring equitable participation in secure and decent employment has the potential to address health and social inequities, including gender inequities, by providing equal opportunities to obtain a secure income (16).
F g .7 P m b b
x, M mb S
F g .8 C w k w w k 40
m w k b x, M mb S
2.5 Income security and social protection
The risk of poverty directly correlates with early-onset morbidity and premature mortality. Repeated or long-term exposure to financial insecurity predicts the likelihood of poor self- reported health, depression and the inability to meet the basic needs to live a healthy life, such as food, fuel and shelter (15). Non-stigmatizing social protection policies have positive effects on reducing health inequities related to income insecurity and poverty.
Investment in social protection for families and early childhood reduces health inequities by weakening the link between socioeconomic disadvantage and poor child health outcomes, including infant mortality and adverse child development (8,17). Such investment contributes to meeting children’s basic needs and helps them reach their full potential in life and health, irrespective of their or their parents’ sex, disability, race, ethnicity, origin, religion, and economic or other status (18).
Social protection programmes that support older people have an impact on health equity by maintaining their capacity to avoid health risks, access health services and perform daily tasks, especially for those with financial and health vulnerabilities. Older people, especially those from low-income backgrounds, are likely to have greater health-care needs or caring responsibilities for partners, and financial support through pension systems helps reduce their risk of ill health, disability and social exclusion (19). Women live longer than men, spending more of their lives in ill-health and are more likely to have caring responsibilities. Social protection and pension provision among women are key to addressing the resulting gender gaps in health, wellbeing and social conditions of older women.
F g .8 C k
, M mb S
Income below 6 % of median eq ivali ed di po able income (EUSILC) or national pover y line (World
Bank)
3) Deep dive into equity across the life course
3.1 Demographic change
The age structure of the region is changing, but not in exactly the same way in every Member State. Two simple summaries of the age structure of a country are the ratio of children (ages 0 to15) to working age adults (ages 15 to 64) and the ratio of old people (ages 65 and over) to working age adults. These ratios affect both the number and types of health events that occur in a country – often forming the focus of the health system – and also the capacity of the working age population to fund public services – principally health, social protection, education and pensions – required by children and the elderly, particularly the most vulnerable.
In every member State in the region, the ratio of older people (aged 65 and over) to those of working age (ages 15 to 64) increased in the ten years to 2024. At the same time, the ratio for those below working age (aged under 15) increased in around half of Member States and decreased in the other half of States. While a decrease in the ratio of young people reduces the short-term burden, in the longer term it suggests a reduction in the size of the working population. Although the two scenarios ultimately require similar policy responses, these will differ in terms of timescales and implementation plans.
These changes form the backdrop to the life course approach taken in this section, emphasizing what is happening to inequalities in children and young people, how ageing healthily varies across social groups and how gender differences persist across the region.
Health advantage and disadvantage accumulates across the life course – from the point of conception (and before), the conditions in which a child’s parents find themselves influences the child’s development, health and life chances. These influences are amplified by the education, training and employment opportunities experienced at the end of schooling. These, in turn, affect the income that a person can obtain, the control they have over subsequent life chances and the extent to which they matter in society. These can then influence the pension they receive in retirement. At each stage in this journey, the risk of developing a health problem increases and this can affect life chances and is affected by the conditions experienced. It is this combination of the essential conditions and health that therefore affect whether or not an individual is likely to age healthily.
F g 3. Y g
g
, , M mb
S
Yo n a e dependency
ratio i he ratio of
pop lation a ed nder
year o ha a ed
o 64 year of a e (a a
percen )
Old a e dependency
ratio i he ratio of
pop lation a ed 6 year
and over o ha a ed
o 64 year of a e (a a
percen )
3.2 Children and young people
As indicated above, child development is important to both health in childhood and adolescence and to thriving as an adult – the ability to obtain and maintain the skills needed in adulthood, good work, decent housing and live healthily in a healthy environment.
Psychological factors are important in achieving this trajectory to good health. This includes a sense of wellbeing and mattering, life satisfaction, freedom from bullying and depression and a positive digital life. These are all interconnected. Failing physical or mental health at an early age can easily derail this trajectory to good health.
F g 3. P g - 5 g b m
ffl x, 00 - 0
So rce: HBSC, 4 co n rie
F g 3.3 P g 5 g
b m ffl x, M mb S
F g 3.4 P g - 5 g b g b w
m m , b ’ m m x (HDI)
x, 00 - 0
So rce: HBSC, 44 co n rie
F g 3.5 P g g 5 g m m m
m m g, b ’ m m x (HDI)
x, 00 - 0
So rce: PIS , 44 co n rie
F g 3.6 C g g 5 4
w m m , g b x, M mb S
3.3 Healthy ageing
As described above, healthy ageing is a process that evolves through life and, consequently, the key equity aspects of this process are summarized in the preceding sections. In this section, the focus is therefore on how people prepare for old age – in terms of pension and long-term care provision- and the consequences this has for equity in old age – differences in pension coverage and health status.
F g 3.7 C - - k m g-
m g GDP, M mb S
F g 3.8 C x b
- g g w (PPS), M mb S
F g 3.9 P g 65 g m
b m b , M mb S
3.4 Gender
Gender differences permeate all aspects of life. Wherever the data permits, the preceding sections provide disaggregation by sex and highlight the existence of differences in the essential conditions and outcomes. In this section, the emphasis is on drawing tother the story painted by the data and identifying factors that are specially about gender roles – such as parenting – and gender-related violence. The absence of routine data on many gender-related issues is of concern.
F g 3. 0 W k m , b
, M mb S
( ) M
(b) F
F g 3. I m b m m m mb , m
00,000
So rce: E ro a , co n rie
4) Modelling
In the report, a variety of modelling tools are used to indicate (a) quantify the role of the five essential conditions (or their component indicators) in creating the equity gap in specific outcomes (such as limiting illness) in different contexts (such as life course stage, gender, sub-region) (b) the association between a change in one or more component indicators (such as poverty) and the size of the equity gap, indicating the potential, quantifiable reduction in the equity gap that could be achieved by taking action on specific social conditions (c) conversely, quantifying the extent to which improved health outcomes are associated with improved social conditions (e.g. improved mental health is associated with reduced unemployment). The technical details of the methodologies used in each type of modelling are summarized in Annex 2in the health equity gap.
F g 4. D m q g m g b g g R g
F g 4. R q g w m m q
m
F g 4.3 M ff m , b x m q
Income quintile Income quintile
4.4 R g , m m g
m m w m b m ,
0 0- 0 3
he effec of a one percen improvemen in ei her limitin illne or depre ion in red cin he nemploymen and NEE S ra e
5) Summary – equity trackers
The equity trackers provide an array of traffic lights that summarise, for each Member State, either (a) the level of inequality in each essential condition (or in the component indicators of an essential condition) or (b) whether the trend in inequality has shown a significant widening over time. These dashboards enable Member States to see, at a glance, where they are making progress and, conversely, where they need to focus greater effort.
F g 5. L
q
, b
M mb S
5.
q
,
b M mb
S
F g 4.3 L
q
m,
b M mb
S
References
1. Health Equity Status Report initiative (HESRi) products: 2019 https: www.who.int europe initiatives health-equity-status-report-initiative hesri-products
2. Developing the Second European Programme of Work 2026-2030 (EPW2):2025 https: www.who.int europe activities developing-the-second-european-programme-of- work
3. WHO constitution (with amendments): 2025 https: www.who.int about governance constitution
4. Tudor Hart, J The inverse care law. The ancet, 1971, Volume 297, Issue 7696, 405 - 412 https: doi.org 10.1016 S0140-6736(71)92410-X
5. Cylus J, Thomson S, Evetovits T. Catastrophic health spending in Europe: equity and policy implications of different calculation methods. Bull World Health Organ. 2018;96(9):599–609. doi:http: dx.doi.org 10.2471 B T.18.209031.
6. Poverty, social exclusion and health systems in the WHO European Region. Copenhagen: WHO Regional Office for Europe; 2010 http: www.euro.who.int __data assets pdf_file 0004 127525 e94499.pdf?ua=1.
7. egido-Quigley H, McKee M, Nolte E, Glinos I. Assuring the quality of health care in the European Union. Geneva: World Health Organization; 2008 (Observatory Studies Series No. 12; http: www.euro.who.int __data assets pdf_file 0007 98233 E91397.pdf?ua=1.
8. Jensen BB, Currie C, Dyson A, Eisenstadt N and Melhuish E. Early years, family and education task group: report. Review of social determinants of health and the health divide in the WHO European Region. Copenhagen: WHO Regional Office for Europe; 2013 https: iris.who.int bitstream handle 10665 344815 9789289000567-eng.pdf?sequence=1
9. Closing the gap in a generation: health equity through action on the social determinants of health. Final report of the commission on social determinants of health. Geneva: World Health Organization; 2008 (https: apps.who.int iris bitstream handle 10665 43943 9789241563703_eng.pdf?sequen ce=1.
10. Kruglanski, A.W., Prilleltensky, I., Raviv, A. (Eds.). (2025). The Routledge International Handbook of Human Significance and Mattering (1st ed.). Routledge. https: doi.org 10.4324 9781003424437
11. Wilkinson RG, Pickett KE. Income inequality and social dysfunction. Annu Rev Sociol.2009;35:493–511. doi: 10.1146 annurev-soc-070308-115926.
12. Rocco , Suhrcke M. Is social capital good for health? A European perspective. Copenhagen: WHO Regional Office for Europe; 2012 http: www.euro.who.int __data assets pdf_file 0005 170078 Is-Social-Capital-good-for- your-health.pdf?ua=1.
13. Braubach M, Jacobs D, Ormandy D. Environmental burden of disease associated with inadequate housing: a method guide to the quantification of health effects of selected housing risks in the WHO European Region. Copenhagen: WHO Regional Office for Europe; 2011 http: www.euro.who.int __data assets pdf_file 0017 145511 e95004sum.pdf?ua=1.
14. Friedli . Mental health, resilience and inequalities. Copenhagen: WHO Regional Office for Europe; 2009 http: www.euro.who.int __data assets pdf_file 0012 100821 E92227.pdf?ua=1.
15. Bell R. Psychosocial pathways and health outcomes: informing action on health inequalities. ondon: UC Institute of Health Equity; 2017 http: www.instituteofhealthequity.org resourcesreports psychosocial-pathways-and- health-outcomes-informing-action-on-health-inequalities psychosocial-pathways-and- health-outcomes.pdf.
16. Siegrist J, Rosskam E, eka S. Work and worklessness: final report of the task group on employment and working conditions, including occupation, unemployment and migrant workers. Review of social determinants of health and the health divide in the WHO European Region. Copenhagen: WHO Regional Office for Europe; 2016 (http: www.euro.who.int __data assets pdf_file 0004 334354 EWC-task-report.pdf?ua=1.
17. Baker P, Hone T, Reeves A, Avendano M, Millet C. Does government expenditure reduce inequalities in infant mortality rates in low- and middle-income countries? A time- series, ecological analysis of 48 countries from 199 to 2013. Health Econ Policy aw. 2019;14(2):249–73.doi: 10.1017 S1744133118000269
18. What matters most for early childhood development: a framework paper. Washington (DC): World Bank; 2013 (SABER Working Paper Series No. 5; http: documents.worldbank.org curated en 359991468331202884 pdf 901830NWP0no500 0Box385307B00PUB IC0.pdf.
19. World report on ageing and health. Geneva: World Health Organization; 2015 (https: apps.who.int iris bitstream handle 10665 186463 9789240694811_eng.pdf?seque nce=1.
Annex 1. Methods to derive indicators
A1.1 Selection of indicators
Indicators were selected for inclusion in the 2nd Health Equity Status Report (HESRi2) Dataset to provide a pragmatic set of measures that were based on accessible data and cover health equity status and policy progress across the five underlying conditions of health equity: Health Services, Social and Human Capital iving Conditions, Employment and Working Conditions and Income Security and Social Protection. Certain key criteria were considered in selecting indicators, in consultation with the Scientific Expert Advisory Group and the HESRi2 Country Partners Group.
The HESRi2 aimed to include indicators that:
• clearly related to priority areas for action on health equity for which there is a clear evidence base and reflected in the WHO Euro Health Equity Policy Tool;
• related to areas of action in which Member States have already made commitments;
• were relevant to the full range of country contexts across the WHO European Region;
• provided a balance of measures across the five underlying conditions for health equity;
• provided as much coverage of countries across the Region, consistent with ensuring a good representation of inequalities in countries that do not provide data to the Statistical Office of the European Union (i.e. to Eurostat);
• used data recoded on international or intranational databases that had been collected though consistent processes across countries in order to support more reliable comparisons;
• used data that could be disaggregated by socioeconomic status, or that were related to policies and expenditure known to have an impact on health inequities;
• used openly accessible data from international datasets, which could be feasibly collected and analysed given the available timescale and resources;
• used data that were reasonably current and that could be updated to track trends.
Initial, the list of 108 HESRi1indicators were reviewed, to assess the feasibility of updating them. New indicators were added, either to replace those that could not be updated or to address topics that were in scope, but not covered in HESRi1. This process was reviewed by the Scientific Expert Advisory Group and the HESRi2 Country Partners Group and through
wide consultation against the criteria listed above; as a result,122 indicators were selected for inclusion in the Health Equity Dataset.
A1.2 Data sources
Data from several sources were used to derive the indicators featured in the Health Equity Dataset. Data were obtained from sources such as household and other population-based surveys, administrative and financial data systems and surveillance systems. Where obtainable, publicly available data were used. For example, a number of indicators were derived from datasets containing national-level data published by the Organisation for Economic Cooperation and Development (OECD), World Bank, International abour Organization I O), United Nations Children’s Fund (UNICEF), Food and Agriculture Organization (FAO), International Monetary Fund (IMF), World Value Survey (WVS), Global Data ab (GD ), Global Burden of Disease (GBD), European Institute for Gender Equality (EIGE), World Justice Project, and the Eurostat database from the Statistical Office of the EU. Eurostat data were obtained through a data-sharing agreement (RPP 85 2018- FS-EU-SI C- EHIS). The responsibility for all conclusions drawn from the data lies entirely with the authors.
Where data were not publicly available, survey microdata, which contained information available at the individual level, were used to derive indicators. Official requests were made to access survey microdata, using (for example) the European Union Statistics on Income and iving Conditions instrument (EU-SI C), the WHO STEPwise approach to Surveillance (STEPS) tool, and the European Health Interview Survey (EHIS; included in the list below). Empirical data collected from these nationally representative surveys, among others, were compiled and processed to create indicators.
Details of each of the databases, surveys and other sources used and the acronyms used for them in this document are listed below.
Acronym Database/survey details EHIS European Health Interview Survey [online database]. Luxembourg:
Statistical Office of the European Union (Eurostat) (https://ec.europa.eu/eurostat/web/microdata/european-health- interview-survey).
EQLS European Quality of Life Surveys (https://www.eurofound.europa.eu/surveys/european-quality-of- lifesurveys). European Foundation for the Improvement of Living and Working Conditions (Eurofound). European Quality of Life Survey integrated data file, 2003–2016 (data collection). 3rd Edition. Colchester: UK Data Service; 2018 (SN: 7348) http://doi.org/10.5255/UKDA-SN-7348- 3).
ESS European Social Survey (http://www.europeansocialsurvey.org/). ESS Cumulative Data Wizard, ESS 1-8. Data file edition 1.0. Bergen: Norwegian Centre for Research Data; 2018 (doi:10.21338/NSD-ESS- CUMULATIVE).
EU-LFS European Union Labour Force Survey [website]. Data and publication. Luxembourg: Statistical Office of the European Union (Eurostat) (https://ec.europa.eu/eurostat/statistics- explained/index.php/EU_labour_force_survey_%E2%80%93_data_and_p ublication).
Eurostat Eurostat [online database]. Luxembourg: Statistical Office of the European Union (http://ec.europa.eu/eurostat/data/database).
EU-SILC European Union Statistics on Income and Living Conditions [online database]. Luxembourg: Statistical Office of the European Union (Eurostat) (http://ec.europa.eu/eurostat/web/microdata/europeanunion- statistics-on-income-and-living-conditions).
EWCS European Working Conditions Survey (https://www.eurofound.europa.eu/surveys/european- workingconditions-surveys). Eurofound. European Working Conditions Survey integrated data file, 1991–2015 (data collection). 7th Edition. Colchester: UK Data Service; 2018 (SN: 7363) (http://doi.org/10.5255/UKDASN-7363-7).
GBD Global Burden of Disease Collaborative Network [online database]. Seattle (WA): Institute for Health Metrics and Evaluation (IHME) (http://ghdx.healthdata.org/organizations/global-burden- diseasecollaborative-network).
GDL Global Data Lab [online database]. Nijmegen: Raboud University Institute for Management Research (https://globaldatalab.org/).
HBSC Health Behaviour in School-aged Children [online database]. Bergen: HSBC Data Management Centre (https://www.uib.no/en/hbscdata).
ILO ILOSTAT [online database]. Statistics of the International Labour Organization. Geneva: International Labour Organization (http://www.ilo.org/ilostat/).
MICS Multiple Indicator Cluster Surveys [online database]. New York (NY): United Nations Children’s Fund (http: mics.unicef.org surveys).
OECD OECD. Stat data warehouse [online database]. Paris: Organisation for Economic Co-operation and Development (https://stats.oecd.org/).
PISA OECD PISA [online database]. Programme for International Student Assessment. Paris: Organisation for Economic Co-operation and Development (http://www.oecd.org/pisa/data/).
STEPS WHO STEPwise approach to Surveillance [website]. Geneva: World Health Organization (https://www.who.int/ncds/surveillance/steps/en/).
UNICEF UNICEF data [online database]. New York (NY): United Nations Children’s Fund (https://data.unicef.org).
WHO EHIG
European Health Information Gateway [online database]. Copenhagen: WHO Regional Office for Europe (https://gateway.euro.who.int/en/).
WHO GHED
WHO Global Health Expenditure Database [online database]. Geneva: World Health Organization (https://apps.who.int/nha/database).
WHO GHO
WHO Global Health Observatory data repository [online database]. Geneva: World Health Organization (http://www.who.int/gho/en/).
WHO UNICEF
WHO/UNICEF Joint Monitoring Programme (JMP) for Water Supply, Sanitation and Hygiene [online database]. Geneva: World Health Organization and United Nations Children’s Fund (https://washdata.org/data).
UN IGME
UN Inter-agency Group for Child Mortality Estimation (https://data.unicef.org/resources/un-inter-agency-group-for-child- mortality-estimation-unigme/)
WJP World Justice Project Rule of Law Index [online database]. Washington (DC): World Justice Project (https://worldjusticeproject.org/our- work/wjp-rule-law-index).
World Bank
World Bank Data Catalogue [online database]. Washington (DC): The World Bank Group (https://data.worldbank.org/data-catalog).
WVS Inglehart, R., C. Haerpfer, A. Moreno, C. Welzel, K. Kizilova, J. Diez- Medrano, M. Lagos, P. Norris, E. Ponarin & B. Puranen (eds.). 2022. World Values Survey: All Rounds - Country-Pooled Datafile. Madrid, Spain & Vienna, Austria: JD Systems Institute & WVSA Secretariat. Dataset Version 3.0.0. doi:10.14281/18241.17
A1.3 Data processing
Following data collection, individual datasets containing primary data were stored in a secure data warehouse for processing. In order to maximize country coverage, indicators were created by combining datasets from different sources, if comparable data were available. Data processing involved, where necessary, data cleaning and suppression of implausible values and cells based on small samples (counts of <50 respondents). Data were aggregated by country and year, as well as characteristics such as sex, age group, education level and income, using survey weights where available to adjust for sampling errors and biases. To facilitate comparison between countries with different age profiles, health outcome indicators were directly age standardized with the WHO World Standard Population. For some analyses, countries were aggregated by geographical region, as follows: Caucasus, central Asia, central Europe, Nordic countries, Russian Federation, South-eastern Europe western Balkans, southern Europe and western Europe (see Annex 3).
For the majority of indicators, income quintiles were calculated based on equivalized disposable household income. Where possible, levels of education were based on the International Standard Classification of Education (ISCED) 2011, or the earlier classification, ISCED 1997. The ISCED educational levels are often aggregated to form a three-category education variable, with: (1) low-level education, which is pre-primary to lower secondary education only; (2) mid-level education, which represents upper-secondary to post- secondary nontertiary education; and (3) high-level education, which is tertiary education. Indicators within HESRi2 were disaggregated by this three-category variable for educational level, where available. Where an indicator is not disaggregated by either income or education, but is available for regions within a country, these regions are grouped by income per capita. Although poorer regions tend to have worse outcomes than richer ones this is not always the case because other factors may affect regional differences in some countries (e.g. the urban rural composition of regions).
Data processing was conducted using R statistical software (version 3.4.3). A panel of regional experts, scientific advisors and members of international organizations approved the methods used and the interpretation of the indicators, prior to publication.
The primary equity measure derived was the absolute difference between the most and least disadvantaged groups (e.g. based on education or income). The trend indicators are based on the (linear) slope index of inequality to calculate an annual rate of change, as well as statistical significance. They use all available data for the indicator since 2010 to calculate the trend. Trends were assessed as increasing if the linear trend across all the data points available was significantly greater than 0 (p<0.1) or decreasing if the linear trend across all the data points available was significantly lower than 0 (p<0.1); otherwise, the trend was labelled as having no noticeable change.
A1.4 Limitations
Certain limitations need to be taken into account when interpreting the indicators and users should refer to the original source documentation to assess the quality of the data collection and measurement methods.
Differences in methodologies – such as the extent to which samples are representative of populations – and differences in survey instruments and definitions may limit the comparisons that can be made between countries and within countries over time. Individuals from lower socioeconomic groups are often underrepresented in population- based surveys, which may limit generalizability. Additionally, self-reported outcomes may be influenced by response biases and cultural differences, and, when comparing countries with diverse health services, differences in self-reported health outcomes may reflect access to care, rather than real differences in morbidity.
Whilst every effort has been made to achieve as much coverage of countries across the Region as possible, consistent with ensuring a good representation of inequalities in countries not providing data to Eurostat , only 17of the selected indicators cover 50 or more of the countries in the WHO European Region. This highlights the need for a coordinated approach to monitoring health equity within the Region going forward.
Annex 2. Modelling
A2.1 Decomposition analysis
Demanding microdata requirements for the decomposition analysis means that this analysis is only possible for inequities in a select number of health indicators.
Decompositions of contributors to self-reported health, limiting illness, mental health and life satisfaction are possible using microdata from ESS and EUSI C for 32 countries in the WHO European Region, consisting of the 27 EU countries, Iceland, Norway, Serbia, Switzerland, and the United Kingdom. There is sufficient data for underlying conditions in all five areas to be analysed, showing that differences in conditions in all five areas are statistically significant in explaining inequities in these health indicators (Fig. 2.2).
A2.2 Technical details of the decomposition method
The idea behind the decomposition analysis is to explain the differences in health indicators that were observed between socioeconomic groups in Section 1 by a set of contributing factors that differ systematically between these groups.
This helps to understand the multisectoral conditions behind why health inequities exist between groups of people within countries, even when effective health services are in place that aim to narrow or eliminate inequities in health and health care. For example, differences in health may be explained by differences in housing conditions and working conditions, as well as by differences in quality of health care. Even if countries are able to narrow inequities in one factor, inequities may still remain in others, emphasizing the importance of taking a multisectoral approach to tackling health inequity.
The decomposition analysis reveals the extent to which each factor contributes to health inequities compared to each of the other factors. The method used in the Health Equity Status Report (HESR) is a simulation-based decomposition that relies on coefficients from a single, pooled regression model, a principle related to the variant of the Oaxaca decomposition method proposed by Neumark (1) and Oaxaca Ransom (2). The decomposition is based on regression analysis of the relationships between self-reported health and the indicators of underlying conditions. It should be noted that while this analysis provides an explanation of health inequity in terms of statistical associations, the regression model used does not constitute a causal analysis and therefore the results should not be interpreted as a stand-alone guide to policy – the decomposition results should be interpreted with care and only in context with other evidence.
The analysis first quantifies the overall health inequality by calculating a health gradient, in this case the Slope Index of Inequality. The decomposition then proceeds through a counterfactual simulation for each underlying condition. To determine the contribution of a single factor (e.g. employment), we simulate a scenario where that factor is set to its optimal value for all individuals in the population. By predicting health outcomes in this simulated scenario and recalculating the health gradient, we can measure how much the overall inequality is reduced. This reduction is considered the contribution of that specific factor to the total health gap.
A2.3 Equity Tracker
he ineq ali y index in he eq i y racker wa calc la ed in he followin way: i. for ho e indica or ha are di a re a ed by ocioeconomic a :
a. he lope index i calc la ed acro ocioeconomic ro p b. where here are m ltiple mea re of ocioeconomic a ch a ed cation and income, a
in le compo i e ocioeconomic rank i fir crea ed by avera in he e variable , and hen ed o calc la e he lope index
ii. he mea re calc la ed in ep (i) i andardized by cen erin i on he mean for all co n rie and dividin by i andard deviation. In hi way, he me ric ed i mea red in andard deviation .
Where he indica or i no di a re a ed by ocioeconomic a b ha an obvio relation hip wi h ineq ali y direc ly (e. . pover y ra e , Gini), he e were j andardized a (ii) above. nn al mea re were e tima ed for each indica or. da a may be mi in for ome year for differen co n rie and differen indica or , we moo h o da a be ween year by:
i. akin he 3-year movin avera e for each indica or ii. E timatin mi in year by akin he linear rend be ween non-mi in year of da a wi hin
co n rie or ro p of indica or ( ch a each of he five e ential condition ), he andardized mea re for each indica or were hen combined acro indica or ca e orie , by akin he avera e for all non-mi in andardized indica or in each ro p for each co n ry. imilar approach wa ed o avera e acro ro p of year . inally, o crea e he - o- index een in he racker , he e contin o domain core are conver ed in o q intile . Wi hin each domain, all co n rie are ranked by heir core and divided in o five eq al ro p , wi h ' ' repre entin he lowe ineq ali y and ' ' repre entin he hi he ineq ali y.
A .4 m g w g m q w g q g . This is produced by taking the annual measures of the standardized indicators over the years 2010-2023, as derived in A2.3 and fitting a linear regression model with country fixed effects. This estimates the extent to which change in equity in each of the conditions over time within a country is associated with change in equity in self-reported health (based on the standardized slope index as in A2.3). The model also includes sex and year as control
variables to account for average differences between sexes and for underlying linear time trends. For all indicators in the chart a reduction in equity in conditions is independently associated with a reduction in health equity (and vice versa). A .5 M g ff m m .
This is based on a logistic regression model with the outcome measure, such as poor health, social isolation measured as a binary outcome (e.g. poor health vs. not poor health), controlling for sex, age, age squared and age-sex interactions. The intervention is measured as a three-way interaction between the country’s pension coverage, the standardized expenditure per pension recipients and an indicator of whether a respondent is over the country’s effective pension age for that year. This model is then used to simulate how the outcome changes, within each sex and income quintile. The simulation specifically models the effect of a best-practice scenario (i.e. pension coverage at the maximum observed level and expenditure at least at the European average) to estimate the potential impact on population health and well-being. A .6 H w b m g k b
m k x .
) L m g
First, the percent of 16–24-year-olds who report a limiting illness for each educational group for each country and year is combined with I O data on the percent (in each education group for each country and year) who are not in education, employment or training (NEET). This is used in a linear regression model with percent NEET as the outcome and the one to three- year lagged values of limiting illness as the exposure with country fixed effects. The coefficients for each lagged year are combined to estimate the effect of the cumulative trending limiting illness, over three years, on NEET. A comparable analysis is then performed using youth unemployment as the outcome variable in place of NEET. ) D
As there are only two time points for this indicator, a simpler approach is used. The difference between the two time points in depression prevalence for each country and the difference in the two labour market outcomes, NEET prevalence and youth unemployment, for each country are calculated. Then, to estimate the association, two separate regression models are fitted. In the first model, the change in the NEET rate is regressed on the change in depression. In the second, the change in youth unemployment is regressed on the change in depression.
Annex 3. Country clusters
Member States have been grouped according to policy and political commonalities. The clusters also aim to reflect the countries that Member States compare themselves to. This grouping does not coincide with preexisting WHO country groupings.
Country Cluster
Annex 4 List of HESRi Database indicators
Indicator title Indicator definition Data sources
Latest year
Health status Morbidity Alcohol consumption Percentage of adults aged 18-64 years who drink
alcohol daily (age adjusted) STEPS EHIS 2023
Alcohol consumption (risky single occasion drinking)
Percentage of adults aged 18-64 years engaging in risky single occasion drinking at least once a month (age adjusted)
STEPS EHIS 2023
Children reporting multiple health complaints
Percentage of children aged 11-15 experiencing two or more health complaints weekly
HBSC 2022
DALYs due to occupational exposure
DALYs attributable to occupational risks and exposures (age standardized rate per 100,000)
GBD 2021
Limitations in activities of daily living
Percentage of adults reporting limitations in daily activities due to health problems
EU-SILC ESS 2024
Obesity/Overweight Percentage of adults aged 18-64 years who are obese (age adjusted)
STEPS EHIS 2023
Prevalence of self- reported CVD
Percentage of adults aged 18-64 years reporting cardiovascular disease (age adjusted)
STEPS EHIS 2023
Prevalence of self- reported diabetes
Percentage of adults aged 18-64 years reporting diabetes (age adjusted)
STEPS EHIS 2023
Serious injuries in children Percentage of children aged 11-15 having required medical treatment for 3 or more injuries in past year
HBSC 2018
Smoking Percentage of adults aged 18-64 years who are current smokers
STEPS EHIS 2023
Mortality
Infant mortality rate Infant mortality rate for children aged less than 1 year (per 1000 live births)
World Bank Eurostat GDL
2019
Life expectancy at birth Life expectancy at birth in years GDL 2022
Tuberculosis mortality Age-standardized tuberculosis death rate per 100,000 population
WHO 2022
Under-five mortality rate
Under-five mortality rate (per 1000 live births) UN IGCME 2022
Wellbeing
Adult life satisfaction Percentage of adults reporting poor life satisfaction
ESS WVS 2023
Adult self-reported health
Percentage of adults reporting poor or fair health
EU-SILC ESS WVS
2024
Center for Epidemiological Studies Depression Score (CES- D8)
Proportion of people at high risk of clinical depression
ESS 2014
Children pressured by schoolwork
Percentage of children aged 11-15 reporting being pressured by schoolwork
HBSC 2022
Children's life satisfaction
Percentage of children aged 11-15 years reporting poor life satisfaction
HBSC PISA 2022
Children's self-reported health
Percentage of children aged 11-15 years reporting poor or fair health
HBSC 2022
Physical inactivity in children
Percentage of children aged 15 years who are physically active
PISA 2022
Problematic social media use in children
Percentage of children aged 11-15 showing symptoms of social media disorder
HBSC 2022
Self-reported work- related health condition
Percentage of adults aged 15-64 years reporting a work-related health problem (age adjusted)
EU-LFS via Eurostat
2020
Health services
Access to health care
Avoidable hospital admissions
Number of avoidable hospital admissions per 100,000 people
Eurostat GDL
2021
Cancer screening (cervical) Percentage of women reporting ever having a cervical cancer screening
STEPS EHIS
2023
Hospital beds Available hospital beds per 100,000 inhabitants
Eurostat OECD GDL
2022
Informal care Percentage of those aged 18-64 years who provide informal care for people with disabilities at least once a week (age adjusted)
EHIS 2019
People with diabetes treated Percentage of people aged 18-64 with diabetes who are receiving treatment
STEPS 2023
People with hypertension treated
Percentage of people aged 18-64 with hypertension who are receiving treatment
STEPS 2023
Physicians or doctors Number of physicians or doctors per 100,000 inhabitants
Eurostat OECD GDL
2022
Public expenditure on health Current health expenditure as a percentage of GDP
WHO 2023
Public expenditure on long- term care
Total expenditure on long-term care as a percentage of GDP
Eurostat OECD
2023
Public spending on public health services
General government expenditure on public health services as a percentage of GDP
IMF Eurostat OECD
2023
Self-reported unmet needs for health care
Percentage of people reporting unmet needs for health care
EU-SILC WVS
2024
Financial protection for health
Household out-of-pocket payments on long-term care
Household out-of-pocket payments on long- term care as a percentage of GDP
OECD 2023
Households with catastrophic health spending
Percentage of households with out-of-pocket payments that are greater than 40% of their capacity to pay for health care
WHO Barcelona Office
2022
Households with impoverishing health spending
Percentage of households that are impoverished or further impoverished after out-of-pocket payments
WHO Barcelona Office
2022
Out-of-pocket expenses Out-of-pocket expenses as a percentage of current health expenditure
WHO 2023
Social and human capital
Human capital
Adult literacy rate Percentage of adults aged 15+ years who are literate
UNESCO via World Bank
2023
Children developmentally on track
Percentage of children aged 36-59 months who are developmentally on track
MICS 2019
Children/youth minimally proficient in reading and maths
Percentage of children aged 15 years achieving minimum proficiency in mathematics and reading
PISA 2022
Government expenditure on early childhood education
Government expenditure on early childhood education in purchasing power standards (PPS) per child under 5 years of age
Eurostat 2021
Participation in early childhood education
Percentage of children aged 36 to 59 months participating in early childhood education
UNICEF Eurostat
2022
Participation in education and training
Percentage of adults aged 25-64 years participating in formal and non-formal education and training
Eurostat 2023
Young people not in employment/education/training
Percentage of young people who are not in employment, education or training
ILO Eurostat
2023
Social Capital
Children's exposure to Bullying Percentage of children aged 11-15 reporting being bullied in school 2-3 times a month
HBSC 2022
Children's exposure to Cyberbullying
Percentage of children aged 11-15 reporting being cyberbullied 1-2 times a month
HBSC 2022
Equal treatment under the law and absence of discrimination
Score from 0-1 on the World Justice Project Rule of Law Index measuring equal treatment under the law and absence of discrimination
World Justice Project
2024
Freedom of choice and control over life
Percentage of people aged 18+ years reporting low levels of freedom of choice and control over their own life
WVS 2022
Frequency of meeting socially Percentage of people aged 16+ years who meet with family/friends less than once a month
EU-SILC ESS
2023
Gender Equality Index Score from 1-100 on the Gender Equality Index
EIGE 2024
Having someone to ask for help Percentage of people aged 16+ years who don't have someone to ask for help
EU-SILC 2022
Participation in voluntary activities
Percentage of people aged 16+ years participating in formal voluntary activities
EU-SILC 2022
Perceived ability to influence politics
Percentage of people aged 18+ years reporting having no ability to influence politics
ESS 2023
Self-reported social support in young people
Percentage of children aged 11-15 years reporting low peer support
HBSC 2022
Social Institutions and Gender Index
Score from 0-100 on the Social Institutions and Gender Index
OECD 2023
Trust in others Percentage of adults aged 18+ years reporting low trust in other people
ESS WVS 2023
Trust in politicians Percentage of people aged 16+ years reporting low levels of trust in politicians
ESS 2023
Living environment
Commercial determinants
Daily breakfast consumption in schoolchildren
Percentage of children aged 11-15 missing breakfast on any schoolday
HBSC 2022
Food insecurity Percentage of people who cannot afford to eat an adequate meal
EU-SILC WVS
2023
Food Price Index Food Price Index (2017=100) Eurostat World Bank
2025
Moderate or severe food insecurity
Percentage of the population experiencing moderate or severe food insecurity (3-year average)
FAO 2022
Tobacco tax Tobacco taxes as a percentage of price of the most sold brand
WHO 2022
Value-added tax (VAT) on alcohol
Value-added tax (VAT) on alcohol WHO 2019
Digital environment
Internet use Percentage of people aged 16+ years who never use the internet
ESS WVS 2023
Environment
Annual mean PM10 concentrations
Annual mean concentration of PM10 in cities WHO 2022
Annual PM2.5 emissions Total annual PM2.5 emissions (ton) GDL 2022
DALYs due to air pollution DALYs attributable to air pollution (age standardized rate per 100,000)
GBD 2021
Diesel cars Diesel powered passenger cars as a percentage of all registered passenger cars
Eurostat 2023
Feeling unsafe from crime in own home
Percentage of adults aged 18+ years feeling unsafe from crime in their own home
WVS 2022
Feeling unsafe walking alone after dark
Percentage of adults feeling unsafe when walking alone in their area after dark
ESS 2023
Intentional homicide Intentional homicide by intimate partner or family member, victims per 100,000 population
Eurostat 2023
Neighbourhood security Percentage of people aged 16+ years who don't feel secure living in their neighbourhood
WVS 2023
Physical violence in children Percentage of children aged 11-15 reporting having been in 3 or more physical fights in past year
HBSC 2018
Pollution/grime/other environmental problems
Percentage of people reporting pollution, grime or other environmental problems in their area
EU-SILC 2023
Public spending on housing and community amenities
General government expenditure on housing and community amenities as a percentage of GDP
IMF Eurostat OECD
2023
Reported crime, violence and vandalism
Percentage of people aged 16+ years reporting local problems with crime, violence or vandalism
EU-SILC 2023
Road deaths Estimated road traffic deaths per 100,000 population
WHO 2019
Housing
Basic drinking water services Percentage of people without at least basic drinking water services (an improved source within a 30 minute round trip to collect water)
WHO UNICEF
2022
Basic sanitation services Percentage of people without at least basic sanitation services (improved sanitation facilities that are not shared with other households)
WHO UNICEF
2022
DALYs due to unsafe sanitation
DALYs attributable to unsafe sanitation (age standardized rate per 100,000)
GBD 2021
Households receiving housing allowance
Percentage of households receiving housing allowance
OECD 2022
Housing cost overburden rate Percentage of people living in a household where housing costs are more than 40% of disposable household income (net of housing allowances)
EU-SILC 2023
Housing overcrowding Percentage of people living in an overcrowded dwelling
EU-SILC 2023
Inability to adequately heat home
Percentage of people who cannot afford to keep their home adequately warm
EU-SILC 2023
Severe housing deprivation rate
Percentage of people living in an overcrowded dwelling that also lacks a bath and indoor toilet, or is damp or too dark
EU-SILC 2023
Employment and working conditions
Job security
Employment rate Percentage of those in employment among those aged 16-64 years
EU-SILC ESS WVS
Labour force participation rate
Percentage of the population either working or looking for work
ILO 2024
Proportion of the poorest quintile population covered by labour market programs
Percentage of the poorest quintile in the population covered by unemployment benefits and active labor market programs
World Bank
2020
Public expenditure on labour market policies
Public expenditure on labour market programmes (active and passive) as a percentage of GDP
OECD 2022
Redundancy pay at 2 years of tenure, in months
Number of months of redundancy pay at two years of job tenure
ILO 2020
Temporary employees Temporary employees as percentage of the total number of employees aged 20-64 years
Eurostat 2023
Unemployment benefit coverage
Percentage of unemployed persons receiving regular periodic social security unemployment benefits
ILO 2023
Unemployment rate Percentage of unemployed persons in the labour force
ILO 2024
Working conditions
Accidents at work Percentage of workers aged 15-64 years reporting at least one non-fatal accident at work in the past 12 months
EULFS via Eurostat
2020
Average wages/earnings Average nominal monthly earnings of employees in 2021 USD PPP
ILO 2023
Collective bargaining coverage
Percentage of employees whose pay and/or conditions of employment are determined by one or more collective agreements
ILO 2020
Disability employment ratio Ratio of employment rates between people without disabilities and people with disabilities, aged 16-64 years
EU-SILC 2023
Feeling about household's income
Percentage of people aged 16+ years reporting difficulties living on their household's income
ESS 2023
Gone without cash income Percentage of people aged 16+ years reporting they sometimes or often have to get by without an income
WVS 2022
In-work poverty Percentage of employed persons aged 18+ years with income below 60% of median equivalised disposable income (after social transfers)
EU-SILC 2023
Labour inspectors Average number of labour inspectors per 10,000 employed persons
ILO 2023
Labour share of GDP (wages and social protection transfers)
Percentage of GDP allocated to labour compensation, comprising wages and social protection transfers
ILO 2024
Low financial satisfaction Percentage of people aged 16+ years reporting low levels of satisfaction with the financial situation of their household
WVS
Low job control Percentage of the population aged 16-64 years, reporting low levels of control over how their daily work is organised
ESS
Minimum wage Statutory nominal gross monthly minimum wage in constant 2021 USD PPP
ILO 2024
Working excessive hours Percentage of workers working 40+ hours per week
ILO 2024
Working excessive hours (more than 45 hours per week)
Percentage of the population aged 16-64 years, working more than 45 hours per week
ESS
Income security and social protection Poverty and inequality
Adequacy of social assistance programmes
Social assistance transfers received by beneficiaries as a percentage of their total income or consumption
World Bank
2021
Coverage of social assistance programmes
Percentage of the population participating in social assistance programs
World Bank
2021
Disability poverty ratio Ratio of poverty rates (percentage below 60% of median income) between people with disabilities and people without disabilities, aged 16-64 years
EU-SILC 2023
Gini index Gini index of income inequality from 0-100 World Bank
2022
Incidence of social assistance programmes
Social assistance program beneficiaries in each income quintile as a percentage of total number of social assistance program beneficiaries
World Bank
2021
Poverty Percentage of the population with income below 60% of median equivalised disposable income (EUSILC) or national poverty lines (World Bank)
EU-SILC World Bank
2024
Public spending on social protection
General government expenditure on social protection as a percentage of GDP
IMF Eurostat OECD
2023
Public spending on social protection for children and families
General government expenditure on social protection for children and families, as a percentage of GDP
Eurostat 2023
Public spending on social protection for sickness and disability
General government expenditure on social protection for sickness and disability, as a percentage of GDP
Eurostat 2023
Public spending on social protection for unemployment
General government expenditure on social protection for unemployment, as a percentage of GDP
Eurostat 2023
Risk of child poverty Percentage of children aged 0-18 at risk of poverty or social exclusion
Eurostat 2024
Vulnerable people covered by social assistance programmes
Percentage of poor persons covered by social protection systems
ILO 2023
Supporting older people Pension coverage Percentage of the population above statutory
pensionable age receiving an old age pension ILO 2023
Pension expenditure per beneficiary
Annual pension expenditure per beneficiary for old-age pensions in purchasing power standards (PPS)
Eurostat 2022
Pension net replacement rate
Individual net pension entitlement as a percentage of net pre-retirement earnings
OECD 2022
Supporting parenting
Length of paid maternity and parental leave
Length of paid maternity and parental leave available to mothers in weeks
OECD 2021
Length of paid paternity and parental leave
Length of paid paternity and parental leave available for fathers in weeks
OECD 2021
Maternity benefits Percentage of women giving birth receiving maternity cash benefits
ILO 2023
Annex references
1. Neumark D. Employers’ discriminatory behavior and the estimation of wage discrimination. J Hu Resour. 1988;23(3):279–295 (https: doi.org 10.2307 145830, accessed 1 April 2019).
2. Oaxaca R , Ransom MR. On discrimination and the decomposition of wage differentials. J Econom. 1994;61(1):5–21 (https: doi.org 10.1016 0304-4076(94)90074-4, accessed 1 April 2019).
3. Hendramoorthy M, Kupek E, Petrou S. Self-reported health and socio-economic inequalities in England, 1996–2009: Repeated national cross-sectional study. Soc Sci Med. 2015;136–137: 135–146 (https: doi.org 10.1016 j.socscimed.2015.05.026, accessed 1 April 2019).
4. Health at a glance: Europe 2016. State of health in the EU cycle. Paris: Organisation for Economic Cooperation and Development; 2016 (https: www.oecd- ilibrary.org docserver 9789264265592- en.pdf?expires=1544454583 id=id accname=guest checksum=7B817E65B, accessed 1 April 2019).
5. Subramanian V, Huijts T, Avendano M. Self-reported health assessments in the 2002 World Health Survey: how do they correlate with education? Bull World Health Organ. 2009;88(2):131–138.
6. Functional and activity limitations statistics [website]. uxembourg: Statistical Office of the European Union; 2017 (https: ec.europa.eu eurostat statistics- xplained index.php Functional_and_activity_limitations_statistics, accessed 1 April 2019).
7. Brown C, Harrison D, Burns H, Ziglio E. Governance for health equity: taking forward the equity values and goals of Health 2020 in the WHO European Region. Copenhagen: WHO Regional Office for Europe; 2014 (http: www.euro.who.int en publications abstracts governance-for-health-equity, accessed 1 April 2019).
8. OECD guidelines on measuring subjective well-being. Paris: Organisation for Economic Co-operation and Development; 2013 (https: www.ncbi.nlm.nih.gov books NBK189567 , accessed 1 April 2019).